


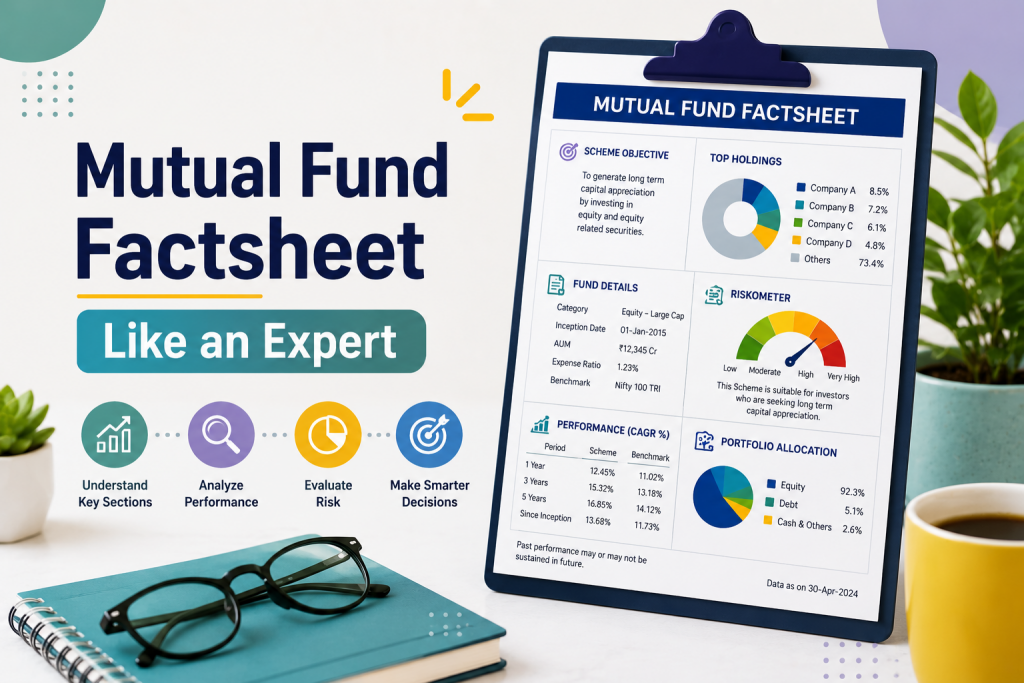
most investors glance at past returns and stop there. the factsheet contains more than a performance table. the sections most people skip carry the most useful information for deciding whether a fund actually fits the portfolio.
fund houses publish factsheets every month. sebi requires it . the data is updated, standardized, and comparable across funds . learning to read it takes less time than most investors assume.
the basics. what sits at the top
the first page tells the investor what the fund is and what it is trying to do.
investment objective. a plain statement of the fund’s goal. long-term capital appreciation. regular income. wealth creation . this needs to align with the investor’s own goals.
fund category. sebi has standardised categories. large-cap, flexi-cap, mid-cap, elss, liquid, short duration, aggressive hybrid, balanced advantage . checking the category confirms whether the fund belongs where the investor intends to place it.
benchmark. the index against which performance is measured. nifty 50 tri, sensex tri, crisil composite bond fund index . a suitable benchmark is essential for fair comparisons.
aum (assets under management). the total capital the fund manages. very small aum in an equity fund can create liquidity problems. very large aum in a mid-cap or small-cap fund can limit the fund manager’s ability to take meaningful positions in smaller companies without moving the price against them .
fund manager. name, experience, and tenure . long, stable tenure boosts confidence that historic results reflect the current decision-makers.
nav, minimums, and load. net asset value per unit, minimum lump sum and sip amounts, and exit load structure . exit load is charged when units are redeemed before a specified period, typically one year for equity funds .
risk-o-meter. sebi’s risk indicator. low to very high . matches the fund’s risk profile to the investor’s tolerance.
the portfolio. where the money actually sits
this section shows what the fund owns. it reveals whether the stated strategy is being followed.
asset allocation. breakdown of equity, debt, and cash . for equity funds, very high cash holding (above 10%) might mean the fund manager is cautious or unable to deploy capital. for hybrid funds, the split between asset classes determines the fund’s risk-return profile.
top holdings. largest individual stocks in the portfolio . if the top 5 stocks make up more than 40% of the portfolio, the fund is fairly concentrated. this means higher risk and higher potential reward.
sector allocation. how much is invested in banking, it, pharma, fmcg, etc. . if one sector dominates (e.g., 35% in banking), the fund’s performance becomes dependent on that sector.
market-cap allocation. for equity funds, the split between large-cap, mid-cap, and small-cap stocks . this shows whether the fund’s actual holdings match its category mandate.
for debt funds, check credit quality (sovereign/aaa/aa and below), average maturity, and modified duration . these drive most of the fund’s risk and return.
the performance. what the returns actually mean
returns mean more when measured against the benchmark over the same period.
period returns. 1-year, 3-year, 5-year, 10-year, and since inception . cagr for 3+ years is the most reliable metric. short-term performance (1 month, 3 months) is noisy and should not be overweighted.
benchmark comparison. a fund that returned 14% over three years looks different if its benchmark returned 17% over the same period . consistent outperformance across multiple timeframes is a good sign.
sip returns. some factsheets show xirr for systematic investment plans . this matters for investors using the sip route.
the risk ratios. what the numbers actually measure
these ratios reveal how the fund generated its returns.
| metric | what it measures | what to look for |
|---|---|---|
| standard deviation | volatility of returns | lower means less volatility |
| beta | sensitivity to benchmark | >1 means more volatile than benchmark; <1 means less |
| sharpe ratio | risk-adjusted return | higher means better return per unit of risk |
| sortino ratio | return relative to downside risk | higher means better downside protection |
| r-squared | how closely the fund follows the benchmark | 85-100% suggests high correlation |
| expense ratio | annual cost of managing the fund | lower means more of the return stays invested |
| portfolio turnover | frequency of trading | higher turnover increases transaction costs |
what to check beyond the numbers
overlap with existing holdings. factsheets show sector and stock holdings. if multiple funds hold the same stocks, that is overlap . this leads to concentration risk. the factsheet helps detect this before it becomes a problem.
fund manager changes. a change in fund manager can alter a fund’s risk-return profile . long, stable tenure boosts confidence that historic results reflect the current decision-makers.
consistency across periods. rolling returns reveal whether the fund has outperformed consistently rather than just benefiting from a single good year .
a simple checklist
- does the category match the investor’s goal
- has the fund consistently beaten its benchmark over 3 and 5 years
- is the expense ratio competitive within the category
- are the top holdings diversified or concentrated in a few stocks
- does the sector allocation create unintended risks
- is the fund manager experienced and stable
- does the risk-o-meter match the investor’s risk tolerance
frequently asked questions
1. what is a mutual fund factsheet ?
a monthly document published by the asset management company. it contains the fund’s performance, portfolio, risk metrics, and costs .
2. where can I find a fund’s factsheet ?
on the amc’s website under the fund’s page. it is freely available .
3. what is the most important section to check ?
the performance versus benchmark and the portfolio concentration. short-term returns are not a reliable guide.
4. what is a good expense ratio for an equity fund ?
for direct plans, 0.3% to 1.0% is typical. lower is better. regular plans cost more .
5. how often are factsheets updated ?
every month. sebi mandates monthly publication .


