


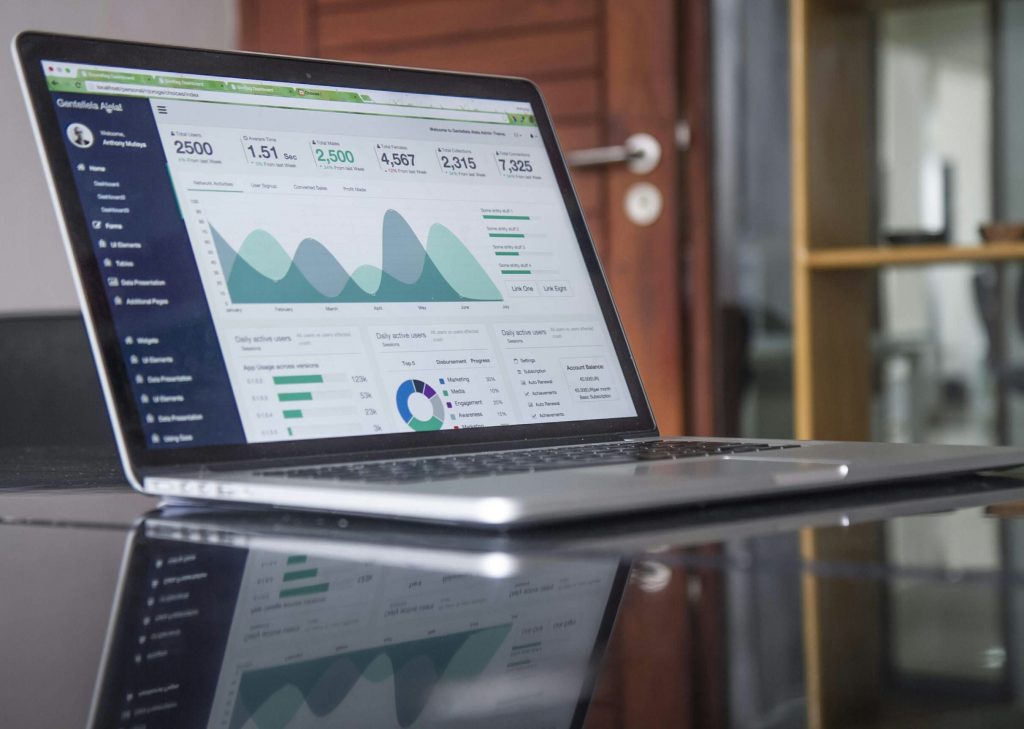
A US stock market chart shows the price of a stock or an index over time. This means the chart displays where the price was, how much it changed and how much trading happened. Most platforms display prices in US dollars. Show times in US Eastern Time. This is different from Indian Standard Time. So when looking at a chart from India the first thing to notice is this difference in time.
Reading a US stock market chart involves a few parts. These include the type of chart the price and time axes, the volume bars and some overlays like moving averages. A chart records what has already happened and does not predict the future. It is best used to understand what has taken place and to choose when to enter a trade not as a signal to trade.
Common chart types
| Chart type | What it shows | Best used for |
|---|---|---|
| Line chart | The closing price of each period connected by a line | To see the trend over months or years. |
| Bar chart (high-low-close) | For each period the open, high, low and close as a vertical bar with small ticks | To see the range of each period. |
| Candlestick chart | The four prices drawn as a candle with a body and wicks | To see the direction and strength of each period quickly. |
How to read a single candle
| Part | Meaning |
|---|---|
| Body | The range between the open and close of the period. |
| Color of the body | On platforms green means the close was higher than the open and red means it was lower. Some platforms use colors. |
| Upper wick | The distance from the top of the body to the periods high. |
| Lower wick | The distance from the bottom of the body to the periods |
| Long wicks | The price moved a lot during the period and then came back showing a battle between buyers and sellers. |
As an example a daily candle with an open of $100 a high of $105 a low of $98 and a close of $103 has a body from $100 to $103 an upper wick from $103 to $105 and a lower wick from $98 to $100. The total range of the day was $7. The stock closed $3 higher than where it started.
The other parts of a chart
| Element | What it shows | How to use it |
|---|---|---|
| Time axis | The date and time of each period in US Eastern Time | Choose the time period from one minute to one month based on the investment plan. |
| Price axis | The price in US dollars on an logarithmic scale | A logarithmic scale shows percentage changes evenly which is helpful on long charts. |
| Volume bars | The number of shares traded in each period | A move on volume is more significant than the same move on low volume. |
| Moving average | The closing price over a set number of periods such as 50 or 200 days | It smooths out the noise and shows the trend direction. |
| Support and resistance | Price levels where the stock has stopped falling or rising | They can indicate levels for limit orders though they can break. |
US market hours on a clock
| Period | US regular hours (Eastern Time) | Indian Standard Time |
|---|---|---|
| US daylight saving time (March to early November) | 9:30 AM to 4:00 PM | 7:00 PM to 1:30 AM |
| US standard time (November to March) | 9:30 AM to 4:00 PM | 8:00 PM to 2:30 AM |
Pre-market and after-hours sessions happen outside these times with less trading and bigger gaps between buying and selling prices. A candle for a day shows only the regular session on many charts so moves in extended hours can appear as a gap between one days close and the next days open.
A step-by-step way to read a chart
| Step | What to do |
|---|---|
| 1. Pick the time frame | Use an weekly chart for a long-term view and a daily chart for timing an entry. |
| 2. Find the trend | Check if the highs and lows are rising, falling or flat and where the price stands against the 50-day and 200-day averages. |
| 3. Mark the levels | Note the highs and lows where the price turned. |
| 4. Check the volume | See if big moves happened with trading. |
| 5. Match the chart to the facts | Compare the moves with news like earnings dates, which often explain the gaps. |
| 6. Convert to rupees where it matters | The value of a holding in rupees changes with both the dollar price and the exchange rate. |
Limits and common mistakes
| Mistake | Why it misleads |
|---|---|
| Treating patterns as predictions | The same pattern can lead to outcomes and the past does not guarantee the future. |
| Using a short time frame | Minute charts are mostly noise and can push investors toward frequent trading with higher costs. |
| Ignoring volume | A price move without volume may not last. |
| Forgetting the time zone | A date on the chart can be different from the date for the same session. |
| Ignoring the exchange rate | A flat dollar chart can still mean a gain or loss in rupees. |
What investors should take from this
A chart is a record of price and trading. It is most helpful when read with the companys fundamentals and the investors own time horizon. Learning an elements well such as the candle, volume and a moving average gives enough to choose sensible limit prices without making charting a habit.
Kuveras guides on US trading hours from India. On placing a limit order for US stocks work well with chart reading when planning an entry.
Frequently Asked Questions
1. What does an red candle mean on a US stock chart?
On platforms a green candle means the price closed higher than the open for the period and a red candle means it closed lower.
2. What time do US markets open in India?
At 7:00 PM time during US daylight saving time and at 8:00 PM during US standard time closing at 1:30 AM and 2:30 AM respectively.
3. What is a moving average?
The average closing price over a chosen number of periods such as 50 or 200 days plotted as a line to show the trend.
4. Which time frame is best for a long-term investor?
Weekly and monthly charts show the long-term trend and a daily chart helps with the timing of an order.
5. Can a chart predict where a stock will go?
No. A chart shows past prices and trading. It can help to understand the trend though it does not forecast the future.
Investments in securities are subject, to market risks. Read all documents carefully. Charts show past prices. Do not guarantee future results.


