Top news
Open ended equity mutual funds witnessed inflows of Rs 15,890 crore in April 2022. The net Asset Under Management (AUM) of the Mutual Fund industry stood at Rs 38.04 lakh crore.
SIP inflows stood at Rs 11,863 crore in April 2022, a jump of 38% compared to inflows of Rs 8596 in the same month last year. Total number of SIP folios jumped to 5.39 crore in April 2022 from 5.27 crore in March.
IPOs of Venus pipes, LIC, Delhivery and Prudent corporate advisory services got oversubscribed by 16.3 times, 2.9 times, 1.6 times and 1.2 times respectively.
Index Returns
| Index | 1W | 1Y | 3Y | P/E | P/B |
|---|---|---|---|---|---|
| NIFTY 50 | -3.8% | 7.3% | 11.9% | 19.8 | 4.0 |
| NIFTY NEXT 50 | -7.1% | 3.3% | 12.2% | 19.0 | 4.0 |
| S&P BSE SENSEX | -3.7% | 8.4% | 12.5% | 21.8 | 3.1 |
| S&P BSE SmallCap | -6.6% | 12.6% | 22.4% | 32.9 | 2.9 |
| S&P BSE MidCap | -5.7% | 5.1% | 15.6% | 20.7 | 2.6 |
| NASDAQ 100 | -2.8% | -12.1% | 17.7% | 26.2 | 6.6 |
| S&P 500 | -2.4% | -3.6% | 11.8% | 20.1 | 4.0 |
Best Performers
| Mutual Funds | 1W | 1Y | 3Y |
|---|---|---|---|
| Nippon India Nivesh Lakshya | 1.1% | -1.3% | 7.4% |
| IPRU Long Term Bond | 1.1% | -1.2% | 6.6% |
| DSP 10y G Sec | 1.1% | -3.6% | 6.0% |
| IPRU Constant Maturity Gilt | 1.1% | 0.0% | 8.0% |
| 1.0% | -0.9% | 7.4% |
| ELSS Tax Saving Funds | 1W | 1Y | 3Y |
|---|---|---|---|
| Parag Parikh Tax Saver | -2.4% | 19.9% | NA |
| Quantum Tax Saving | -2.4% | 8.5% | 10.3% |
| ITI Long Term Equity | -3.3% | -1.6% | NA |
| SBI Long Term Equity | -3.4% | 14.2% | 14.6% |
| -3.4% | 21.2% | 11.4% |
| Stocks (Market cap > Rs 50k Cr) | 1W | 1Y | 5Y |
|---|---|---|---|
| Godrej Consumer Products | 4.6% | -8.9% | 5.3% |
| Bajaj Auto | 3.4% | -6.1% | 5.9% |
| ABB India | 3.1% | 63.7% | 10.3% |
| Hindustan Unilever | 1.3% | -5.8% | 18.3% |
| 1.1% | 39.9% | 12.4% |
Worst Performers
| Mutual Funds | 1W | 1Y | 3Y |
|---|---|---|---|
| DSP World Gold | -9.4% | -18.3% | 14.3% |
| Quant Value | -9.12 | NA | NA |
| Quant Infrastructure | -8.4% | 19.7% | 33.4% |
| ABSL Nifty Small Cap 50 | -8.2% | 8.2% | NA |
| -8.2% | 13.0% | 38.9% |
| Stocks (Market cap > Rs 50k Cr) | 1W | 1Y | 5Y |
|---|---|---|---|
| Vedanta | -27.7% | 3.7% | 13.0% |
| Adani Green Energy | -23.7% | 106.8% | NA |
| Adani Transmission | -21.8% | 84.1% | 90.1% |
| Avenue Supermarts | -18.1% | 13.3% | 34.1% |
| -16.3% | 36.0% | 42.8% |
Bought and Sold
| Bought on kuvera.in | 1W | 1Y | 3Y |
|---|---|---|---|
| Parag Parikh Flexi Cap | -3.8% | 11.8% | 23.0% |
| UTI Nifty Index | -3.7% | 8.5% | 13.3% |
| UTI Nifty Next 50 Index | -7.0% | 4.0% | 13.6% |
| Navi Nifty 50 Index | -3.8% | NA | NA |
| -5.3% | -2.9% | NA |
| Sold on kuvera.in | 1W | 1Y | 3Y |
|---|---|---|---|
| Axis Arbitrage | 0.2% | 4.9% | 5.2% |
| IPRU Nifty Low Vol 30 ETF FoF | -1.8% | 7.3% | NA |
| Quant Multi Asset | -6.8% | 12.6% | 27.5% |
| Axis Triple Advantage | -3.7% | 5.2% | 14.8% |
| 0.2% | 4.2% | 4.7% |
Most Watchlisted
Mutual Fund Watchlist | 1W | 1Y | 3Y |
|---|---|---|---|
| Tata Digital India | -4.4% | 22.1% | 30.2% |
| Parag Parikh Flexi Cap | -3.8% | 11.8% | 23.0% |
| Quant Small Cap | -8.2% | 13.0% | 38.9% |
| Quant Tax | -8.0% | 13.3% | 35.0% |
| -5.7% | 30.1% | 33.1% |
Stocks Watchlist | 1W | 1Y | 5Y |
|---|---|---|---|
| Reliance Industries | -8.1% | 26.9% | 29.4% |
| Adani Green Energy | -23.7% | 106.8% | NA |
| Tata Motors | -5.2% | 24.1% | -2.9% |
| Infosys | -5.1% | 13.3% | 27.4% |
| -2.8% | 10.5% | 25.1% |
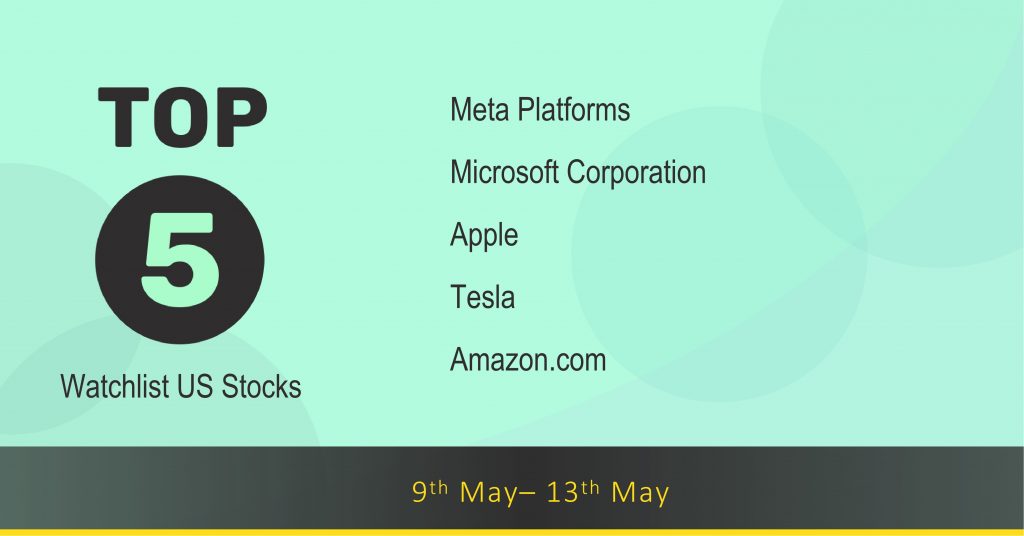
US Stocks Watchlist | 1W | 1Y | 5Y |
|---|---|---|---|
| Meta Platforms | -2.5% | -37.1% | 5.7% |
| Microsoft Corporation | -5.0% | 6.1% | 32.5% |
| Apple | -6.5% | 16.1% | 31.8% |
| Tesla | -11.1% | 30.5% | 63.9% |
| -1.5% | -29.8% | 18.6% |
Data Source: NSE, BSE & Kuvera.in
Interested in how we think about the markets?
Read more: Zen And The Art Of Investing
Watch/hear on YouTube:
Start investing through a platform that brings goal planning and investing to your fingertips. Visit kuvera.in to discover Direct Plans and Fixed Deposits and start investing today.
This market update was initially published by Livemint.
#MutualFundSahiHai, #KuveraSabseSahiHai!

