


Top news
Mutual funds showed strong buying momentum in January, led by Private Banks, Pharma & Healthcare, and E-Commerce. Significant inflows were also seen in Auto, Ports & Logistics, and Consumer sectors. Broader participation across Insurance, Realty, Telecom, and NBFCs reflects positive institutional sentiment and confidence in India’s growth outlook.
Five IPOs are opening between Feb 20–27, 2026 across healthcare, textiles, renewable energy, jewellery, and engineering sectors. Gaudium IVF (₹165 cr), Shree Ram Twistex (₹110 cr), Clean Max Enviro Energy Solutions (₹3,100 cr), PNGS Reva Diamond Jewellery (₹380 cr), and Omnitech Engineering (₹583 cr) are book-build issues. Retail investment starts around ₹12,000–₹15,000 per lot. Listings are scheduled between Feb 27 and Mar 5, 2026.
Angel One AMC has launched NFO for Angel One Silver ETF FoF Growth Direct Plan, Old Bridge AMC has launched NFO for Old Bridge Flexi Cap Growth Direct Plan, Groww AMC has launched NFO for Groww BSE Hospitals ETF FoF Growth Direct Plan, Edelweiss AMC has launched NFO for Edelweiss Gold ETF FoF Growth Direct Plan, Baroda BNP Paribas AMC has launched NFO for Baroda BNP Paribas ESG Best In Class Strategy Growth Direct Plan, ITI AMC has launched NFO for ITI Business Cycle Growth Direct Plan, LIC MF AMC has launched NFO for LIC MF Technology Growth Direct Plan, and Motilal Oswal AMC has launched NFO for Motilal Oswal Multi Factor Passive FoF Growth Direct Plan.
Index Returns
| Index | 1W | 1Y | 3Y | P/E | P/B |
|---|---|---|---|---|---|
| NIFTY 50 | 0.4% | 11.6% | 12.50% | 22.4 | 3.5 |
| NIFTY NEXT 50 | 0.9% | 13.8% | 21.70% | 19.5 | 3.6 |
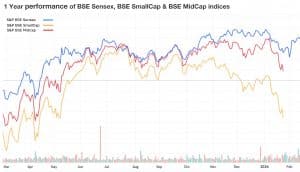
| S&P BSE SENSEX | 0.2% | 9.4% | 8.90% | 22.7 | 4.4 |
| S&P BSE SMALLCAP | -1.9% | -3.2% | 21.8% | 28.1 | 3.7 |
| S&P BSE MIDCAP | -1.3% | 6.4% | 21.7% | 34.4 | 5.3 |
| NASDAQ 100 | 1.1% | 15.7% | 12.7% | 26.5 | 3.8 |
| S&P 500 | 1.1% | 14.9% | 10.4% | 29.7 | 5.5 |


Best Performers
| Mutual Funds | 1W | 1Y | 3Y |
|---|---|---|---|
| SBI BSE PSU Bank Index Growth | 6.1% | NA | NA |
| IPRU Bharat 22 FoF Growth | 2.6% | 27.9% | 28.4% |
| Groww BSE Power ETF FoF Growth | 2.5% | NA | NA |
| Kotak Nifty200 Value 30 Index Growth | 2.4% | NA | NA |
| IPRU Nifty200 Value 30 Index Growth | 2.4% | 38.2% | NA |
| ELSS Tax Saving Funds | 1W | 1Y | 3Y |
|---|---|---|---|
| Taurus Taxshield | 1.02% | 3.20% | 15.00% |
| Samco ELSS Tax Saver | 0.9% | 7.8% | 8.5% |
| Quant ELSS Tax Saver | 0.8% | 15.9% | 18.5% |
| Bank Of India ELSS Tax Saver | 0.6% | 14.5% | 18.7% |
| Parag Parikh ELSS Tax Saver | 0.6% | 5.6% | 16.7% |
| Stocks (Market cap < Rs 50k Cr) | 1W | 1Y | 5Y |
|---|---|---|---|
| Indian Bank | 7.5% | 80.0% | 46.1% |
| Union Bank Of India | 7.2% | 68.8% | 36.8% |
| Punjab National Bank | 7.1% | 39.6% | 25.3% |
| Cummins India | 6.9% | 76.0% | 43.8% |
| Bank Of Baroda | 6.6% | 48.0% | 27.7% |
Worst Performers
| Mutual Funds | 1W | 1Y | 3Y |
|---|---|---|---|
| Groww Nifty Capital Markets ETF FoF Growth | -3.1% | NA | NA |
| Groww Nifty India Internet ETF FoF Growth | -2.8% | NA | NA |
| Tata Nifty Capital Markets Index Growth | -2.5% | 39.2% | NA |
| Motilal Oswal Nifty Capital Market Index Growth | -2.4% | 39.5% | NA |
| UTI Innovation Growth | -2.4% | -1.2% | NA |
| Stocks (Market cap > Rs 50k Cr) | 1W | 1Y | 5Y |
|---|---|---|---|
| Muthoot Finance | -14.9% | 52.8% | 21.7% |
| Eternal | -9.6% | 15.1% | NA |
| Waaree Energies | -8.6% | 30.5% | NA |
| Alkem Laboratories | -8.2% | 13.7% | 13.4% |
| Lloyds Metals & Energy | -6.7% | -2.5% | NA |
What Investors Bought
| Most Bought MF | 1W | 1Y | 3Y |
|---|---|---|---|
| Parag Parikh Flexi Cap | -0.6% | 7.9% | 20.6% |
| HDFC Flexicap | -0.9% | 16.3% | 22.6% |
| HDFC Mid Cap | -1.1% | 20.2% | 26.5% |
| UTI Nifty 50 Index | -1.4% | 12.0% | 13.4% |
| Nippon India Multi Asset Allocation | -1.1% | 26.3% | 22.9% |
What Investors Sold
| Most sold MF | 1W | 1Y | 3Y |
|---|---|---|---|
| SBI Arbitrage Opportunities | 0.2% | 7.0% | 7.7% |
| Invesco India Arbitrage | 0.2% | 7.1% | 7.8% |
| Quant Mid Cap | -2.2% | -0.6% | 15.5% |
| Quant Multi Cap | -2.3% | 2.8% | 12.2% |
| Quant Small Cap | -2.3% | 8.0% | 20.1% |
Most Watchlisted
Mutual Fund Watchlist | 1W | 1Y | 3Y |
|---|---|---|---|
| Axis Nifty 50 Index Growth Direct Plan | 0.4% | 12.0% | 13.4% |
| Axis Small Cap Growth Direct Plan | 0.4% | 12.8% | 18.7% |
| 1.0% | 15.4% | 22.0% | |
| Parag Parikh Flexi Cap Growth Direct Plan | -0.6% | 7.9% | 20.6% |
| HDFC Flexicap Growth Direct Plan | 0.4% | 16.3% | 22.6% |
Stocks Watchlist | 1W | 1Y | 5Y |
|---|---|---|---|
| Hindustan Copper | -4.8% | 155.7% | 46.0% |
| Nippon India ETF Gold BeES | 1.1% | 76.2% | 26.0% |
| Tata Silver ETF | 1.6% | 151.6% | NA |
| SBI Gold ETF | 1.1% | 76.3% | NA |
| Tata Gold ETF | 1.1% | 77.1% | NA |
US Stocks Watchlist | 1W | 1Y | 5Y |
|---|---|---|---|
| 7.3% | 74.1% | 22.1% | |
| NVIDIA Corporation | 3.8% | 45.7% | 66.2% |
| Microsoft Corporation | -1.0% | -1.7% | 10.5% |
| Netflix | 2.3% | -2.4% | 7.8% |
| Apple, Inc. | 3.4% | 7.1% | 15.3 |
Data Source: NSE, BSE & Kuvera.in
Strategies for navigating Market Cycles.
Watch/hear on YouTube:

Start investing through a platform that brings goal planning and investing to your fingertips. Visit kuvera.in to discover Direct Plans and Fixed Deposits and start investing today.
Disclaimer: Mutual Fund investments are subject to market risks. Read all scheme related documents carefully.
Registration granted by SEBI, membership of IAASB (in case of IAs) and certification from NISM in no way guarantee performance of the intermediary or provide any assurance of returns to investors.
Investment in the securities is subject to market risks. Read all the related documents carefully before investing.
The securities quoted are for illustration only and are not recommendatory.
This market update was initially published by Livemint.
#MutualFundSahiHai, #KuveraSabseSahiHai!