Top news
EPFO to invest 5% of its annual deposits in alternative investment funds (AIFs) including infrastructure investment trusts (InvITs).
Shares of Latent View Analytics and Tarsons Products got listed at a premium of 169% and 6% over issue price of Rs 197 and Rs 662 respectively while IPO of GoColors got oversubscribed by 135.4 times.
Nippon MF, HDFC MF, Tata MF and Axis MF have launched the NFOs for Nippon India Taiwan Equity Growth Direct Plan, HDFC Multi Cap Growth Direct Plan, Tata Corporate Bond Growth Direct Plan and Axis Multicap Fund
Index Returns
| Index | 1W | 1Y | 3Y | P/E | P/B |
|---|---|---|---|---|---|
| NIFTY 50 | -0.7% | 38.0% | 18.8% | 23.5 | 4.3 |
| NIFTY NEXT 50 | 0.8% | 47.7% | 17.4% | 22.8 | 4.3 |
| S&P BSE SENSEX | -4.2% | 28.9% | 17.3% | 26.7 | 3.5 |
| S&P BSE SmallCap | -2.5% | 70.1% | 25.1% | 42.7 | 3.2 |
| S&P BSE MidCap | -4.1% | 49.6% | 18.6% | 27.3 | 3.1 |
| NASDAQ 100 | 2.0% | 35.2% | 33.3% | 35.1 | 9.1 |
| S&P 500 | 0.9% | 29.1% | 19.6% | 25.3 | 4.7 |
Best Performers
| Mutual Funds | 1W | 1Y | 3Y |
|---|---|---|---|
| HSBC Brazil | 2.9% | -15.4% | -9.5% |
| SBI Healthcare Opportunities | 2.1% | 24.8% | 24.7% |
| IPRU Pharma Healthcare & ... | 1.9% | 26.7% | 28.5% |
| Mirae Asset Healthcare | 1.5% | 35.4% | 33.4% |
| 1.4% | 31.3% | 27.6% |
| ELSS Tax Saving Funds | 1W | 1Y | 3Y |
|---|---|---|---|
| Quant Tax | -1.6% | 83.0% | 37.0% |
| PGIM India Long Term Equity | -3.0% | 46.6% | 21.6% |
| ABSL Tax Relief96 | -3.1% | 22.3% | 12.8% |
| Parag Parikh Tax Saver | -3.3% | 41.4% | NA |
| -3.3% | 44.7% | 14.9% |
| Stocks (Top 200 by market cap) | 1W | 1Y | 5Y |
|---|---|---|---|
| Vedanta | 14.3% | 210.3% | 14.6% |
| Zee Entertainment | 9.2% | 81.8% | -4.3% |
| Vodafone Idea | 9.1% | 11.7% | -23.5% |
| Cipla | 8.3% | 32.1% | 11.8% |
| 6.1% | -20.5% | -1.3% |
Worst Performers
| Mutual Funds | 1W | 1Y | 3Y |
|---|---|---|---|
| UTI Transportation & Logistics | -7.2% | 30.9% | 9.1% |
| DSP World Gold | -6.2% | -1.4% | 19.3% |
| JM Core 11 | -5.9% | 24.6% | 12.8% |
| IDBI Banking & Financial Services | -5.7% | 21.7% | 12.3% |
| -5.6% | 29.0% | 13.8% |
| Stocks (Top 200 by market cap) | 1W | 1Y | 5Y |
|---|---|---|---|
| InterGlobe Aviation | -16.1% | 18.7% | 17.3% |
| Maruti Suzuki India | -11.6% | 1.6% | 9.0% |
| IndusInd Bank | -10.6% | 5.5% | -2.7% |
| Muthoot Finance | -10.1% | 28.7% | 39.8% |
| -9.7% | 168.5% | 1.7% |
Bought and Sold
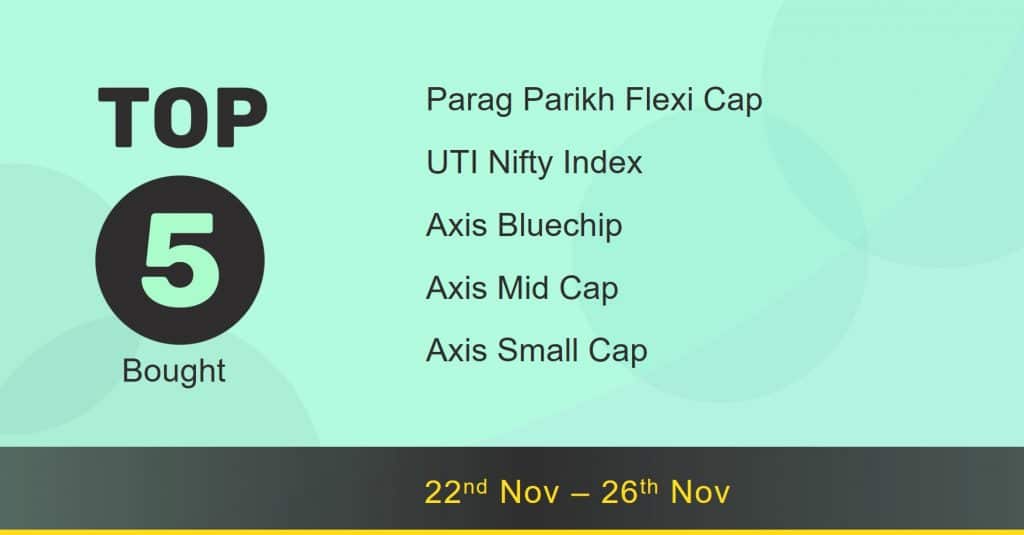
| Bought on kuvera.in | 1W | 1Y | 3Y |
|---|---|---|---|
| Parag Parikh Flexi Cap | -2.2% | 51.4% | 31.2% |
| UTI Nifty Index | -4.1% | 32.4% | 18.1% |
| Axis Bluechip | -4.7% | 30.0% | 21.8% |
| Axis Mid Cap | -4.6% | 48.6% | 28.4% |
| -3.2% | 64.5% | 33.8% |
| Sold on kuvera.in | 1W | 1Y | 3Y |
|---|---|---|---|
| Quant Active | -1.4% | 77.8% | 34.6% |
| Quant Small Cap | -3.1% | 103.4% | 37.1% |
| Franklin India Focused Equity | -3.9% | 52.1% | 21.2% |
| IPRU Equity Arbitrage | 0.2% | 4.6% | 5.4% |
| -4.3% | 40.3% | 24.0% |
Most Watchlisted
Mutual Fund Watchlist | 1W | 1Y | 3Y |
|---|---|---|---|
| Parag Parikh Flexi Cap | -2.2% | 51.4% | 31.2% |
| Tata Digital India | -3.1% | 84.7% | 42.6% |
| IPRU Commodities | -3.1% | 86.1% | NA |
| IPRU Technology | -3.1% | 85.6% | 44.1% |
| -3.1% | 103.4% | 37.1% |
Stocks Watchlist | 1W | 1Y | 5Y |
|---|---|---|---|
| Reliance Industries | -2.5% | 23.8% | 37.8% |
| Adani Green Energy | 1.6% | 19.5% | NA |
| Tata Motors | -9.7% | 168.5% | 0.3% |
| Infosys | -5.1% | 51.4% | 29.8% |
| -0.9% | 27.6% | 25.9% |
US Stocks Watchlist | 1W | 1Y | 5Y |
|---|---|---|---|
| Tesla | -4.8% | 84.7% | 94.0% |
| Apple | -2.3% | 35.3% | 42.9% |
| Microsoft Corporation | -3.9% | 54.5% | 42.4% |
| Amazon | -4.7% | 9.7% | 35.0% |
| -3.5% | 19.9% | 22.6% |
Data Source: NSE, BSE & Kuvera.in
Interested in how we think about the markets?
Read more: Zen And The Art Of Investing
Watch/hear on YouTube:
Start investing through a platform that brings goal planning and investing to your fingertips. Visit kuvera.in to discover Direct Plans and start investing today.
#MutualFundSahiHai, #KuveraSabseSahiHai!

