Top news
SEBI in a circular has introduced a two-tiered benchmarking system for Mutual Fund schemes. The first tier should reflect the category, while the second tier should reflect the fund manager's investment strategy.
Prudent Corporate Advisory Services acquires the Mutual Fund business of Karvy Stock Broking. Karvy Stock Broking Ltd (KSBL) had a total AUM of Rs 9,261 crore as of July 2021.
Shares of IRCTC underwent a stock split in the ratio of 1:5 with change in face value from Rs 10 to Rs 2. The market cap of IRCTC stood at Rs 67,652 crore.
The Finance ministry approved an 8.5% rate of interest on EPF accounts for the Financial year 2020-21.
Index Returns
| Index | 1W | 1Y | 3Y | P/E | P/B |
|---|---|---|---|---|---|
| NIFTY 50 | -2.4% | 51.3% | 19.9% | 25.7 | 4.4 |
| NIFTY NEXT 50 | -0.7% | 53.7% | 17.5% | 25.8 | 4.3 |
| S&P BSE SENSEX | -2.5% | 49.1% | 20.3% | 29.6 | 3.7 |
| S&P BSE SmallCap | -1.2% | 87.7% | 26.3% | 43.4 | 3.3 |
| S&P BSE MidCap | -1.1% | 70.5% | 21.0% | 33.2 | 3.4 |
| NASDAQ 100 | 3.2% | 39.5% | 33.1% | 35.3 | 9.2 |
| S&P 500 | 1.3% | 39.0% | 20.4% | 26.2 | 4.8 |
Best Performers
| Mutual Funds | 1W | 1Y | 3Y |
|---|---|---|---|
| DSP World Gold | 1.6% | -5.6% | 20.2% |
| Nippon India Japan Equity | 1.5% | 24.0% | NA |
| Canara Robeco Infrastructure | 1.5% | 84.1% | 23.7% |
| PGIM India Global Equity | 1.3% | 29.8% | 33.9% |
| 1.2% | 36.4% | 18.5% |
| ELSS Tax Saving Funds | 1W | 1Y | 3Y |
|---|---|---|---|
| Motilal Oswal Long Term Equity | 0.4% | 62.8% | 22.2% |
| Kotak Tax Saver | -0.4% | 55.8% | 24.1% |
| UTI Long Term Equity | -0.7% | 62.9% | 24.1% |
| L&T Tax Advantage | -0.7% | 47.3% | 15.9% |
| -0.7% | 69.6% | 23.3% |
| Stocks (Top 200 by market cap) | 1W | 1Y | 5Y |
|---|---|---|---|
| TVS Motor | 14.8% | 56.1% | 10.5% |
| UltraTech Cement | 7.1% | 70.9% | 14.1% |
| Ambuja Cements | 6.5% | 60.7% | 12.2% |
| InterGlobe Aviation | 6.4% | 68.1% | 19.0% |
| 6.1% | 102.5% | 26.3% |
Worst Performers
| Mutual Funds | 1W | 1Y | 3Y |
|---|---|---|---|
| IDBI Gold | -5.7% | -5.2% | 12.9% |
| IPRU Bharat 22 FOF | -4.4% | 84.1% | 9.4% |
| SBI PSU | -3.5% | 66.6% | 11.7% |
| Invesco India PSU Equity | -3.4% | 61.4% | 21.3% |
| -3.1% | 2.6% | -9.7% |
| Stocks (Top 200 by market cap) | 1W | 1Y | 5Y |
|---|---|---|---|
| Vedanta | -13.3% | 218.0% | 14.2% |
| Adani Ports and SEZ | -11.0% | 96.1% | 18.1% |
| Adani Enterprises | -10.8% | 346.7% | 85.8% |
| NTPC | -10.3% | 51.3% | 4.7% |
| -9.8% | 46.1% | -5.6% |
Bought and Sold
| Bought on kuvera.in | 1W | 1Y | 3Y |
|---|---|---|---|
| Parag Parikh Flexi Cap | -1.7% | 64.7% | 31.3% |
| UTI Nifty Index | -2.4% | 52.8% | 21.0% |
| Axis Bluechip | -1.1% | 48.5% | 25.2% |
| Axis Mid Cap | 0.0% | 66.1% | 30.0% |
| -2.0% | 88.2% | 41.4% |
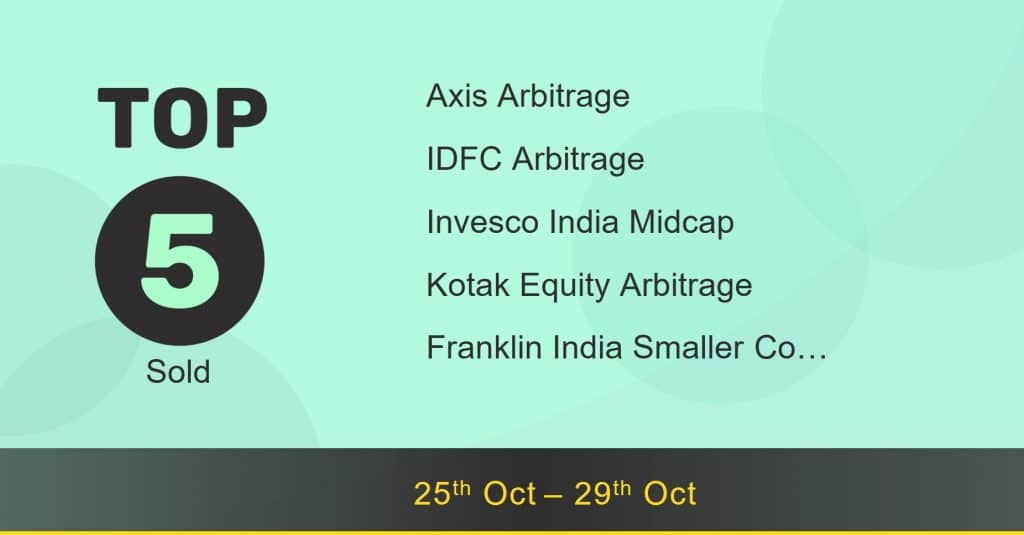
| Sold on kuvera.in | 1W | 1Y | 3Y |
|---|---|---|---|
| Axis Arbitrage | 0.1% | 4.4% | 5.5% |
| IDFC Arbitrage | 0.2% | 4.2% | 5.4% |
| Invesco India Midcap | -0.3% | 68.0% | 26.7% |
| Kotak Equity Arbitrage | 0.2% | 4.5% | 5.5% |
| Franklin India Smaller Co.. | -0.7% | 89.0% | 22.9% |
Most Watchlisted
Mutual Fund Watchlist | 1W | 1Y | 3Y |
|---|---|---|---|
| IPRU Commodities | 0.7% | 131.1% | NA |
| Parag Parikh Flexi Cap | -1.7% | 64.7% | 31.3% |
| Tata Digital India | -2.0% | 88.2% | 41.4% |
| Quant Small Cap | -1.9% | 117.3% | 38.0% |
| -1.9% | 91.2% | 42.1% |
Stocks Watchlist | 1W | 1Y | 5Y |
|---|---|---|---|
| Reliance Industries | -3.3% | 26.2% | 37.5% |
| Adani Green Energy | -4.4% | 47.6% | NA |
| Tata Motors | -4.8% | 258.9% | -2.0% |
| Infosys | -4.9% | 55.0% | 28.9% |
| -3.8% | 29.6% | 24.5% |
US Stocks Watchlist | 1W | 1Y | 5Y |
|---|---|---|---|
| Tesla | 23.2% | 187.1% | 94.5% |
| Apple | -0.1% | 38.5% | 41.2% |
| Amazon.com | -0.8% | 11.1% | 34.2% |
| Microsoft Corporation | 7.1% | 65.3% | 43.0% |
| 6.6% | 163946.2% | 295.6% |
Data Source: NSE, BSE & Kuvera.in
Interested in how we think about the markets?
Read more: Zen And The Art Of Investing
Watch/hear on YouTube:
Start investing through a platform that brings goal planning and investing to your fingertips. Visit kuvera.in to discover Direct Plans and start investing today.
#MutualFundSahiHai, #KuveraSabseSahiHai!

