


Top news
India’s PE and VC investments jumped 46% year-on-year to $17.1 billion in Q3 2026, showing renewed interest in Indian businesses. September alone saw investments worth $7 billion, the highest monthly figure in over two years. Infrastructure and healthcare attracted the most interest, reflecting growing investor confidence in these sectors.
IPO Update: EAAA India Alternatives IPO was subscribed 5.51 times by October 28, 2026, BLS Polymers IPO was subscribed 241.22 times and SFC Environmental Technologies IPO was subscribed 9.47 times by October 29, 2026.
NFO Update: AMCs have launched several new schemes, including Invesco India Silver ETF FoF Growth Direct Plan, Kotak Nifty Realty Index Growth Direct Plan and UTI Financial Services Debt Growth Direct Plan.
Index Returns
| Index | 1W | 1Y | 3Y | P/E | P/B |
|---|---|---|---|---|---|
| NIFTY 50 | 2.0% | -10.9% | 6.5% | 19.3 | 2.8 |
| NIFTY NEXT 50 | 2.9% | -3.4% | 15.5% | 17.1 | 3.3 |
| S&P BSE SENSEX | 1.8% | -11.8% | 8.9% | 19.3 | 4.0 |
| S&P BSE SMALLCAP | 3.5% | -13.4% | 21.8% | 30.9 | 4.3 |
| S&P BSE MIDCAP | 3.4% | -6.5% | 21.7% | 27.1 | 5.4 |
| NASDAQ 100 | -2.0% | 9.8% | 12.7% | 29.0 | 4.9 |
| S&P 500 | -0.6% | 10.8% | 10.4% | 25.9 | 6.0 |


Best Performers
| Mutual Funds | 1W | 1Y | 3Y |
|---|---|---|---|
| Tata Nifty Midsmall Healthcare Index Growth | 9.0% | 16.7% | NA |
| Motilal Oswal Nifty Midsmall Healthcare Index Growth | 9.0% | 16.5% | NA |
| Invesco India Pharma & Healthcare Growth | 7.9% | NA | NA |
| Whiteoak Capital Pharma & Healthcare Growth | 7.5% | 19.5% | NA |
| Bajaj Finserv Healthcare Growth | 7.4% | 19% | NA |
| ELSS Tax Saving Funds | 1W | 1Y | 3Y |
|---|---|---|---|
| Samco ELSS Tax Saver | 4.7% | -5.2% | 2.9% |
| Motilal Oswal ELSS Tax Saver | 3.8% | 0.9% | 19.5% |
| Quant ELSS Tax Saver | 3.7% | 3.0% | 14.4% |
| Axis ELSS Tax Saver | 3.2% | -4.5% | 10.7% |
| Invesco India ELSS Tax Saver | 3.0% | -6.3% | 11.4% |
| Stocks (Market cap < Rs 50k Cr) | 1W | 1Y | 5Y |
|---|---|---|---|
| Eternal | 12.9% | 4.0% | 21.2% |
| Apollo Hospitals Enterprise | 11.1% | 7.5% | 14.7% |
| Zydus Lifesciences | 9.7% | 24.2% | 19.9% |
| Mankind Pharma | 9.5% | 2.0% | NA |
| Dr. Reddy's Laboratories | 9.1% | 8.1% | 7.7% |
Worst Performers
| Mutual Funds | 1W | 1Y | 3Y |
|---|---|---|---|
| Axis Silver FoF Growth | -5.8% | 22.9% | 34.8% |
| DSP Silver ETF FoF Growth | -5.8% | 22.1% | NA |
| HDFC Silver ETF FoF Growth | -5.7% | 22.2% | 34.2% |
| Zerodha Silver ETF FoF Growth | -5.7% | 22.4% | NA |
| Nippon India Silver ETF FoF Growth | -5.6% | 22.4% | 34.0% |
| Stocks (Market cap > Rs 50k Cr) | 1W | 1Y | 5Y |
|---|---|---|---|
| Mazagon Dock Shipbuilders | -11.3% | -38.5% | 67.7% |
| Bajaj Holdings & Investment | -9.5% | -19.0% | 16.2% |
| AU Small Finance Bank | -9.4% | -2.1% | 7.3% |
| Shriram Finance | -8.6% | 11.5% | 23.4% |
| SBI Cards And Payment Services | -7.3% | -42.4% | -13.0% |
What Investors Bought
| A | B | C | D |
|---|---|---|---|
| Most Bought MF | 1W | 1Y | 3Y |
| Invesco India Arbitrage | 0.1% | 6.9% | 7.5% |
| 0.1% | -3.7% | 12.9% | |
| Parag Parikh Flexi Cap | -0.5% | -7.0% | 12.6% |
| Bandhan Small Cap | -0.4% | 1.0% | 21.7% |
| HDFC Flexicap | 3.1% | -4.0% | 15.8% |
What Investors Sold
| A | B | C | D |
|---|---|---|---|
| Most sold MF | 1W | 1Y | 3Y |
| JM Small Cap | 2.6% | 4.6% | NA |
| TrustMF Small Cap | 4.1% | 20.0% | NA |
| Parag Parikh Dynamic Asset Allocation | 0.3% | 1.1% | NA |
| Tata Arbitrage | 0.1% | 6.8% | 7.4% |
| Mirae Asset Large Cap | 2.1% | -7.8% | 8.8% |
Most Watchlisted
Mutual Fund Watchlist | 1W | 1Y | 3Y |
|---|---|---|---|
| Axis Nifty 50 Index Growth | 2.0% | -10.1% | 7.4% |
| Axis Small Cap Growth | 1.8% | 1.0% | 13.2% |
| UTI Nifty Next 50 Index Growth | 2.9% | -7.0% | 12.6% |
| Parag Parikh Flexi Cap Growth | -0.5% | -5.7% | 12.2% |
| Bandhan Small Cap Growth | -0.4% | 1.0% | 21.7% |
Stocks Watchlist | 1W | 1Y | 5Y |
|---|---|---|---|
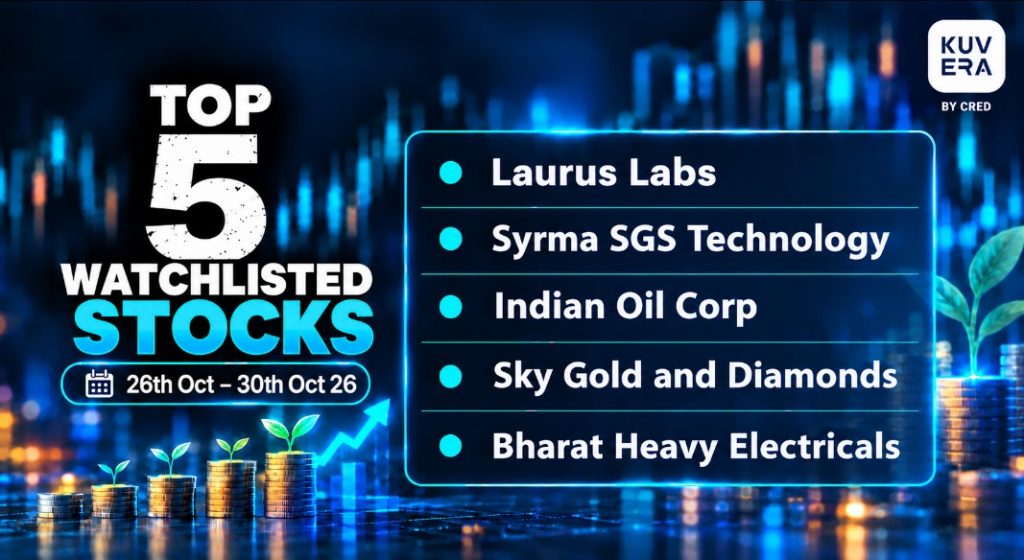
| Laurus Labs | 22.7% | 150.7% | 34.3% |
| Syrma SGS Technology | 14.1% | 102.6% | NA |
| Indian Oil Corp | 0.9% | -15.8% | 14.1% |
| Sky Gold and Diamonds | -17.3% | 152.5% | NA |
| Bharat Heavy Electricals | 0.1% | 63.3% | 42.8% |
US Stocks Watchlist | 1W | 1Y | 5Y |
|---|---|---|---|
| SanDisk Corp | -8.3% | 456.0% | NA |
| Taiwan Semiconductor Manufacturing Co. | -4.3% | 33.2% | 30.6% |
| Oracle Corp. | 3.7% | -49.3% | 6.8% |
| AppLovin Corp | -12.4% | -63.9% | 21.0% |
Data Source: NSE, BSE & Kuvera.in
Strategies for navigating Market Cycles.
Watch/hear on YouTube:

Start investing through a platform that brings goal planning and investing to your fingertips. Visit kuvera.in to discover Direct Plans and start investing today.
Disclaimer: Mutual Fund investments are subject to market risks. Read all scheme related documents carefully.
Registration granted by SEBI, membership of IAASB (in case of IAs) and certification from NISM in no way guarantee performance of the intermediary or provide any assurance of returns to investors.
Investment in the securities is subject to market risks. Read all the related documents carefully before investing.
The securities quoted are for illustration only and are not recommendatory.
This market update was initially published by Livemint.
#MutualFundSahiHai, #KuveraSabseSahiHai!


