Top news
RBI stated that bank account holders can update KYC information without visiting a bank branch by using their email-id, mobile number, ATMs, or other digital means if they have already submitted legitimate documents and have not changed their residence
Shares of Radiant Cash Management Services got listed at a premium of 10% over issue price of Rs 94 while IPO of Sah Polymers got oversubscribed by 17.5 times.
Index Returns
| Index | 1W | 1Y | 3Y | P/E | P/B |
|---|---|---|---|---|---|
| NIFTY 50 | -1.4% | 0.6% | 13.4% | 21.5 | 4.2 |
| NIFTY NEXT 50 | -0.8% | -1.9% | 13.6% | 25.4 | 4.8 |
| S&P BSE SENSEX | -0.2% | 1.9% | 13.0% | 23.3 | 3.4 |
| S&P BSE SmallCap | 0.2% | -3.0% | 27.1% | 23.8 | 2.7 |
| S&P BSE MidCap | -0.6% | -0.7% | 18.5% | 26.3 | 3.0 |
| NASDAQ 100 | 0.9% | -29.2% | 7.8% | 24.0 | 5.8 |
| S&P 500 | 1.5% | -16.7% | 6.4% | 18.9 | 3.9 |
Best Performers
| Mutual Funds | 1W | 1Y | 3Y |
|---|---|---|---|
| Mirae Asset Hang Seng Tech ETF FoF | 8.0% | -7.0% | NA |
| Axis Greater China Equity FoF | 6.0% | -6.8% | NA |
| DSP World Gold | 5.1% | -2.9% | 5.2% |
| Edelweiss Greater China Equity Off Shore | 4.7% | -14.6% | 6.4% |
| PGIM India Emerging Markets Equity | 4.6% | -29.3% | -6.7% |
| ELSS Tax Saving Funds | 1W | 1Y | 3Y |
|---|---|---|---|
| PGIM India ELSS Tax Saver | -0.1% | 3.6% | 21.2% |
| SBI Long Term Equity | -0.2% | 5.8% | 19.4% |
| DSP Tax Saver | -0.4% | 2.5% | 19.0% |
| Mirae Asset Tax Saver | -0.6% | -1.3% | 19.9% |
| Navi ELSS Tax Saver | -0.6% | -2.6% | 13.6% |
| Stocks (Market cap > Rs 50k Cr) | 1W | 1Y | 5Y |
|---|---|---|---|
| IDBI Bank | 9.7% | 16.1% | -3.2% |
| Havells India | 8.1% | -14.8% | 16.1% |
| HDFC Life Insurance | 7.1% | -6.4% | 8.6% |
| Indian Oil Corporation | 7.1% | 2.4% | -2.8% |
| ABB India | 5.9% | 27.7% | 6.5% |
Worst Performers
| Mutual Funds | 1W | 1Y | 3Y |
|---|---|---|---|
| Axis Focused 25 | -3.1% | -18.3% | 9.4% |
| Axis Long Term Equity | -2.9% | -16.2% | 10.2% |
| Mirae Asset NYSE FANG ETF FoF | -2.8% | -34.4% | NA |
| Axis Flexi Cap | -2.7% | -12.0% | 12.9% |
| Axis Bluechip | -2.5% | -9.3% | 11.9% |
| Stocks (Market cap > Rs 50k Cr) | 1W | 1Y | 5Y |
|---|---|---|---|
| Bajaj Finance | -8.2% | -22.0% | 30.4% |
| Avenue Supermarts | -8.0% | -18.0% | 25.4% |
| Adani Power | -6.9% | 183.8% | 45.4% |
| Cholamandalam Investment and Finance | -6.6% | 17.6% | 21.4% |
| Adani Total Gas | -6.3% | 100.7% | NA |
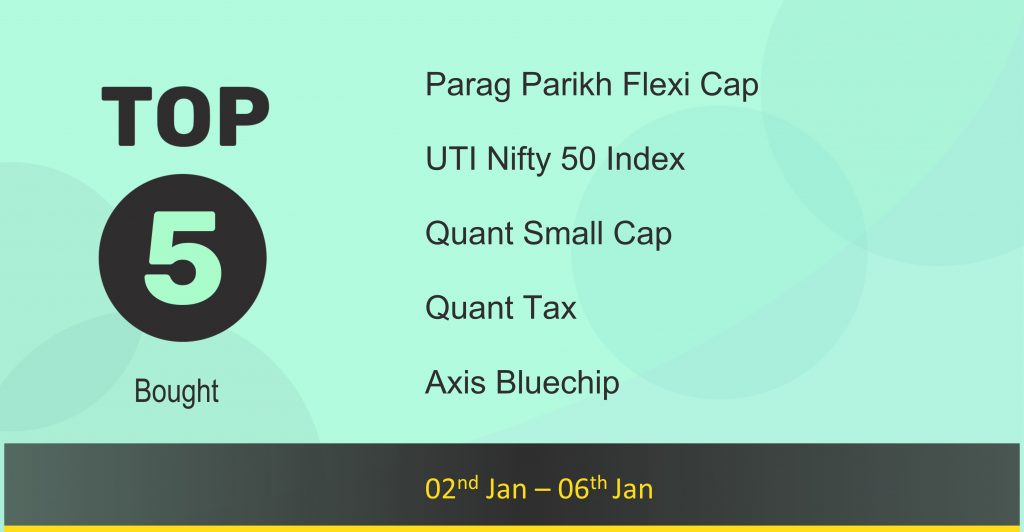
Bought and Sold
| Most Bought MF | 1W | 1Y | 3Y |
|---|---|---|---|
| Parag Parikh Flexi Cap | -1.0% | -6.5% | 22.2% |
| UTI Nifty 50 Index | -1.4% | 1.7% | 15.2% |
| Quant Small Cap | 0.3% | 7.9% | 56.1% |
| Quant Tax | -0.7% | 11.0% | 41.2% |
| Axis Bluechip | -2.5% | -9.3% | 11.9% |
| Most sold MF | 1W | 1Y | 3Y |
|---|---|---|---|
| IPRU Nifty 100 Low Volatility 30 ETF FoF | -0.2% | 0.4% | NA |
| UTI Nifty200 Momentum 30 Index | -0.8% | -7.0% | NA |
| DSP Flexi Cap | -1.5% | -6.7% | 15.8% |
| IPRU Equity Arbitrage | 0.1% | 4.8% | 4.6% |
| Quantum Multi Asset FoF | -0.2% | 6.2% | 9.0% |
Most Watchlisted
Mutual Fund Watchlist | 1W | 1Y | 3Y |
|---|---|---|---|
| Axis Small Cap | -0.8% | 2.6% | 27.5% |
| IPRU Infrastructure | 0.2% | 25.9% | 27.1% |
| Quant Mid Cap | 0.2% | 18.4% | 39.3% |
| Quant Tax | -0.7% | 11.0% | 41.2% |
| Quant Small Cap | 0.3% | 7.9% | 56.1% |
Stocks Watchlist | 1W | 1Y | 5Y |
|---|---|---|---|
| Adani Power Ltd | -6.9% | 183.3% | 43.6% |
| ITC Ltd | -0.1% | 51.9% | 5.0% |
| Adani Enterprises Ltd | 0.4% | 122.9% | 81.7% |
| Yes Bank Ltd | 4.7% | 45.5% | -42.4% |
| Bank of Baroda | -1.1% | 115.8% | 2.5% |
US Stocks Watchlist | 1W | 1Y | 5Y |
|---|---|---|---|
| Amazon.com | 2.5% | -47.1% | 7.0% |
| Microsoft Corporation | -6.2% | -28.4% | 22.0% |
| Apple | -0.2% | -24.7% | 25.5% |
| Tesla | -8.2% | -67.0% | 39.8% |
| Meta Platforms | 8.0% | -60.8% | 1.2% |
Data Source: NSE, BSE & Kuvera.in
Interested in how we think about the markets?
Read more: Zen And The Art Of Investing
Watch/hear on YouTube:
Start investing through a platform that brings goal planning and investing to your fingertips. Visit kuvera.in to discover Direct Plans and Fixed Deposits and start investing today.
This market update was initially published by Livemint.
#MutualFundSahiHai, #KuveraSabseSahiHai!

