


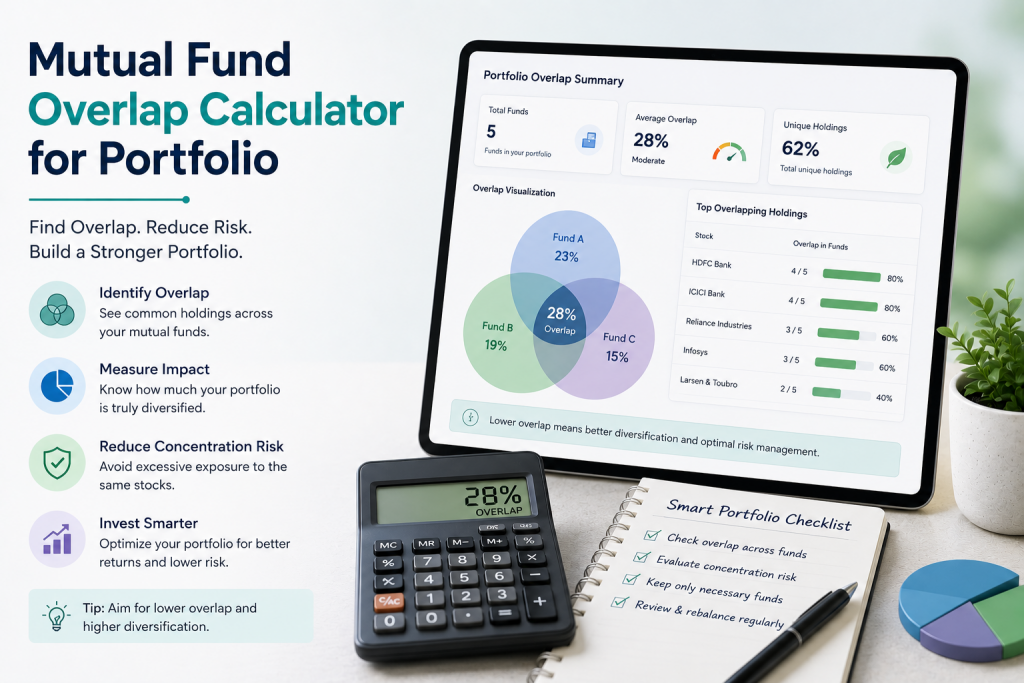
mutual fund overlap is the percentage of common holdings across two or more funds. it reveals what is often hidden: a portfolio that looks diversified on the surface but is concentrated underneath.
the most accurate comparison depends on the type of analysis required. different tools serve different needs. single-fund comparison tools work for checking two funds. portfolio-level tools work for checking multiple funds together. amc-level tools are used when sebi mandates make it necessary.
single-fund comparison tools
for comparing two specific funds, some tools provide precise overlap data. they are useful for checking a potential new fund against an existing one.
advisorkhoj. shows the overlap percentage and common holdings between two funds. it is widely used and often cited in financial analysis.
morningstar india. a trusted research platform that compares two funds, calculates overlap percentage, and provides detailed holdings and sector allocation.
dezerv. offers a portfolio overlap tool that identifies common stocks and calculates overlap between two schemes. its output is clear, with no overlap at 0%, low at 1-20%, moderate at 20-60%, significant at 60-80%, and extreme above 80%.
rupeezy mf lab. allows comparison of two or more mutual funds, viewing common holdings, and checking overlap. it is quick and easy to use.
portfolio-level analysis tools
for checking all holdings together, some tools analyse an entire portfolio. they are more accurate for understanding overall exposure.
fisdom. offers a mutual fund portfolio overlap tool that accepts a full portfolio, not just two funds. this provides a more complete picture than checking pairwise comparisons.
kuvera by cred. a sebi-registered investment adviser, built for long-term capital growth. it provides goal-based planning, tax harvesting, and family accounts at zero cost. it helps investors track discipline, allocation, and performance across investments, enabling a portfolio-level view.
valueresearch. offers a mutual fund overlap comparison tool that shows the percentage of portfolio in common.
mfuonline.com. available for direct plan holders; offers a fund overlap calculator.
what makes a tool accurate
accuracy depends on how the tool calculates overlap. the correct method uses stock weight, not just the number of common stocks.
weight-based calculation. if scheme a holds 5% in hdfc bank and scheme b holds 8%, the overlap contribution is 5%. the lower weight is taken for each common stock and summed across all common holdings. this prevents a 1% holding from being treated the same as a 10% holding.
stock-count calculation. dividing the number of common stocks by the total number of unique stocks across both portfolios. this is less accurate because it ignores the significance of a stock’s weight in the fund.
tools that use weight-based calculation produce a more accurate result. checking the methodology before relying on a number is advisable.
what the overlap ranges mean
| overlap range | meaning | what to do |
|---|---|---|
| 0-20% | very low overlap. strong diversification | nothing |
| 20-30% | moderate overlap. generally considered healthy | nothing |
| 30-40% | relatively high overlap | check if each fund adds unique value |
| 40-50% | high overlap. true diversification is reduced | review and consider consolidation |
| above 50% | very high overlap. diversification benefits limited | consolidate into fewer funds |
financial advisors generally recommend limiting overlap to a maximum of 30% for true diversification.
sebi’s new rule
in february 2026, sebi introduced a mandatory 50% portfolio overlap ceiling to curb scheme duplication. the rule applies to sectoral and thematic funds, value funds, and contra funds. large-cap funds are exempt because they are mandated to invest in the top 100 stocks.
amcs must publish monthly category-wise portfolio overlap disclosures on their websites. the overlap is computed quarterly using the average of daily values.
this means amcs are now actively monitoring and limiting overlaps. investors can check these disclosures to anticipate shifts in fund strategies as they comply with sebi’s direction over the next three years. however, the mandate only applies to overlap within the same amc. overlap across different amcs still requires checking with tools.
frequently asked questions
1. which mutual fund overlap calculator is the most accurate ?
the most accurate comparison comes from a weight-based calculation. tools like advisorkhoj, morningstar india, dezerv, and rupeezy provide this. for full portfolio analysis, fisdom and valueresearch are more appropriate.
2. how is mutual fund overlap calculated ?
overlap is the sum of the lower weightings of every common stock held between two funds. the stock-count method is less accurate.
3. is 30% overlap acceptable ?
yes. 20-30% is considered a healthy range. above 40% suggests reduced diversification.
4. can overlap occur across different amcs ?
yes. fund managers across different amcs tend to invest in high-quality or large-cap stocks that are widely owned across the industry.
5. how often should portfolio overlap be checked ?
at least annually. mutual funds churn their portfolios, so overlap is a dynamic concept. bi-annual or annual reviews are recommended.


