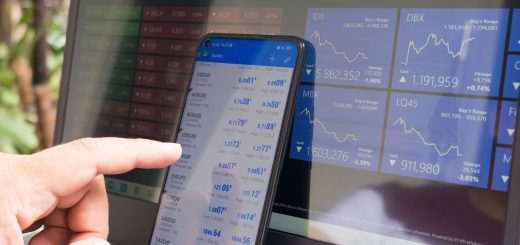
A broad market index, such as the S&P 500, tracks hundreds of companies across every sector of the US economy, while a technology focused index, such as the Nasdaq-100, tracks a smaller group that leans heavily toward technology companies. The two overlap because the biggest US companies are largely technology firms, which is why the broad index already carries a large technology weight.
The difference between technology focused and broad market indices shows up in concentration and in how far each falls when technology falls. In 2022, the Nasdaq-100 fell by roughly a third, and the S&P 500 fell by about 18%, so the technology focused index made a larger swing in both directions over the years. Knowing what each index holds helps an Indian investor decide how much of a portfolio to place in each.
How the main US indices compare
| Index | What it holds | How it is weighted | Tilt |
|---|---|---|---|
| S&P 500 | 500 large US companies chosen by an index committee | Free-float market capitalization | Broad, with technology as the largest sector |
| Nasdaq-100 | The 100 largest non-financial companies listed on the Nasdaq exchange | A modified market capitalization method, with the index reconstituted every year in December | Strongly technology and growth oriented, with no financial companies |
| Total US market indices | Several thousand US companies across large, mid and small sizes | Market capitalization | The broadest spread, with small and mid companies included |
| Dow Jones Industrial Average | 30 large US companies | Price weighted, so higher-priced shares carry more weight | Narrow and not a measure of technology |
Technology focused vs broad market at a glance
| Feature | Technology focused index | Broad market index |
|---|---|---|
| Number of companies | Fewer, often 100 or less | 500 or more |
| Sector spread | Heavy in technology and related growth companies | Spread over technology, health care, financials, industrials and others |
| Concentration | A handful of large companies can make up a big share of the index | Lower, though the largest companies still carry large weights |
| Volatility | Generally higher | Generally lower |
| Typical role in a portfolio | A satellite holding for growth | A core holding for market exposure |
| Valuation sensitivity | High, since growth companies fall hardest when expectations drop | Moderate |
The risks that come with a technology tilt
| Risk | What it means |
|---|---|
| Concentration in a few companies | A fall in a few large companies can move the whole index. |
| Valuation risk | High expectations are built into prices, and a disappointment can cause a large fall. |
| Interest rate sensitivity | Growth companies are valued on future earnings, so rising rates can hit them harder. |
| Overlap with the broad index | An investor who holds both owns the same large technology companies twice. |
| Currency effect | For an Indian investor, the rupee-dollar movement adds to or reduces the return on either index. |
How Indian investors can reach these indices
| Route | How it works | Points to check |
|---|---|---|
| US-listed ETFs | Buy an ETF that tracks the index through a platform, funded under the Liberalised Remittance Scheme (LRS) | The yearly LRS limit of USD 250,000, tax collected at source (TCS) of 20% above ₹10 lakh remitted, and US estate tax for direct holdings. |
| India-domiciled funds and fund of funds | Indian mutual funds and ETFs that track or invest in these indices | Industry-wide limits on overseas investment have at times restricted new subscriptions, and the tax treatment follows the fund’s category. |
| GIFT City funds and receipts | Products based in the International Financial Services Centre at GIFT City | The structure, the tax treatment and the LRS counting differ by product. |
How to choose between the two
| Situation | Fit |
|---|---|
| First US holding, with a long horizon | A broad market index gives wide exposure in a single holding. |
| Already holding Indian equity funds and wanting a growth tilt | A technology focused index adds growth with a higher risk. |
| Low tolerance for falls of 30% or more | A broad market index, or a smaller share in the technology focused one. |
| Wanting to avoid owning the same companies twice | Pick one index, or size the technology focused holding as a small satellite. |
What investors should take from this
A broad market index offers the market, and a technology focused index offers a bet on one part of it that has led for years and can also fall hardest. How much of a portfolio each one takes should follow the investor’s horizon and tolerance for falls, with the broad index as the base.
Kuvera’s guides on what a US broad market index measures and on how to get exposure to US market indices from India cover the same ground from the access side.
Frequently Asked Questions
1. What is the difference between the Nasdaq-100 and the S&P 500?
The Nasdaq-100 holds the 100 largest non-financial companies on the Nasdaq exchange and leans toward technology, while the S&P 500 holds 500 large US companies across all sectors.
2. Is a technology index riskier than a broad market index?
Generally yes. It holds fewer companies, is more concentrated and has fallen further in downturns, such as in 2022.
3. Does the S&P 500 already contain technology stocks?
Yes. Technology is its largest sector, so a holder of both indices owns many of the same companies twice.
4. Can Indians invest in the Nasdaq-100?
Yes, through US-listed ETFs under LRS, through Indian funds that track or invest in it, and through GIFT City products, each with different limits and taxes.
5. Which is better for a long-term investor?
A broad market index suits as a core holding for most long-term investors, and a technology focused index can serve as a smaller satellite for investors who accept larger swings.
Investments in securities are subject to market risks. Read all related documents carefully. Past index returns do not indicate future returns.