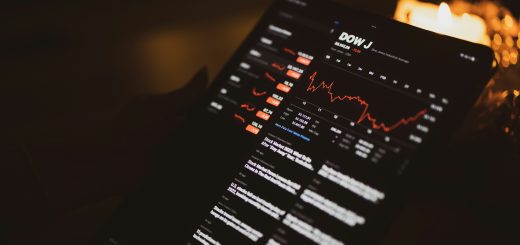
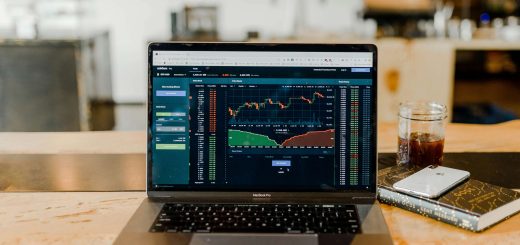
US market indices can be tracked from India through the websites of the index providers, financial news portals, the apps of brokers and any platform that offers US stocks, and most of these show the closing value shortly after the US market closes. The US regular session ends at 1:30 AM Indian time during US daylight saving time and at 2:30 AM otherwise, so an Indian investor reading the morning papers usually sees the previous US day’s closing level.
To track US market indices from India well, an investor needs to know which index measures what, whether the figure shown is a price index or a total return index and how the rupee changes the result. The sections below set out the main indices, where to follow them and how to convert the dollar movement into the return in rupees.
The main US indices
| Index | What it covers | Provider |
|---|---|---|
| S&P 500 | 500 large US companies across all sectors, weighted by free-float market capitalization | S&P Dow Jones Indices |
| Dow Jones Industrial Average | 30 large US companies, weighted by share price | S&P Dow Jones Indices |
| Nasdaq Composite | Thousands of companies listed on the Nasdaq exchange, with a heavy technology weight | Nasdaq |
| Nasdaq-100 | The 100 largest non-financial companies on the Nasdaq exchange | Nasdaq |
| Russell 2000 | About 2,000 smaller US companies | FTSE Russell |
| Cboe Volatility Index (VIX) | The market’s expectation of near-term volatility in the S&P 500 | Cboe |
Where to follow them
| Source | What it offers | Points to note |
|---|---|---|
| Index provider websites | Official levels, factsheets and methodology | The most accurate source, with some data delayed. |
| Financial news portals and data sites | Live or delayed quotes, charts and news | Free versions may show delayed prices. |
| Platform or broker apps | Index levels, watchlists and alerts next to the investor’s holdings | Convenient, with a view limited to what the app shows. |
| Exchange-traded funds that follow the index | A tradable price that moves with the index | The ETF price tracks the index closely and not exactly. |
| Indian news and market summaries | A morning recap of the US close and futures | Useful for a quick view, with less detail. |
Price index and total return index
| Type | What it measures | When it matters |
|---|---|---|
| Price index | Changes in the prices of the stocks only | The level quoted in news reports. |
| Total return index | Price changes plus reinvested dividends | Comparing long-term returns, since dividends form a meaningful part of the total. |
Comparing a price index figure with a fund’s total return overstates the fund’s lead, because the fund’s return includes dividends and the price index does not.
Converting the move into rupees
An Indian investor earns in rupees, so the return on a US index holding combines the dollar return and the change in the exchange rate. The dollar return multiplied by the currency effect gives the rupee return.
| Scenario | Dollar return | Rupee change against the dollar | Return in rupees |
|---|---|---|---|
| Rupee weakens by 3% | +10% | The dollar buys 3% more rupees | About +13.3% |
| Rupee strengthens by 3% | +10% | The dollar buys about 3% fewer rupees | About +6.8% |
| Rupee flat | +10% | No change | +10% |
The first row works out as 1.10 multiplied by 1.03, which is 1.133, and the second as 1.10 divided by 1.03, which is 1.068. The currency effect can add or take away several points in a year, so a flat dollar index can still show a gain or a loss in rupees.
A simple way to track the indices
| Step | What to do |
|---|---|
| 1. Pick two or three indices | The S&P 500 for the broad market and the Nasdaq-100 for technology cover most needs. |
| 2. Choose one primary source | One reliable site or app reduces confusion from small differences between sources. |
| 3. Note the time of the quote | Check whether the figure is live, delayed or the previous close. |
| 4. Use percentage changes | A rise of 100 points means different things at different index levels, while a percentage is comparable. |
| 5. Add the exchange rate | Track the rupee-dollar rate beside the index to see the rupee return. |
| 6. Review at intervals | A weekly or monthly look suits a long-term investor better than a daily one. |
Common mistakes
| Mistake | Why it misleads |
|---|---|
| Checking prices several times a day | Daily moves are noisy and can prompt trades that cost money. |
| Comparing indices of different types | The Dow’s 30 stocks and the Nasdaq-100’s 100 stocks measure different things. |
| Mixing price and total return figures | The gap grows over long periods. |
| Ignoring the time zone | The US date on a chart can differ from the Indian date for the same session. |
| Forgetting the rupee | The rupee return can differ widely from the dollar return. |
What investors should take from this
Tracking US indices is straightforward with one or two sources and a few indices, and it becomes meaningful when the rupee is included and the returns are compared like for like. A calm, periodic review serves a long-term investor better than constant monitoring.
Kuvera’s guides on how to get exposure to US market indices from India and on US trading hours from India explain how to act on what the indices show.
Frequently Asked Questions
1. How can US market indices be followed from India?
Through the websites of the index providers, financial news portals and data sites, and the apps of brokers and platforms that offer US stocks.
2. When do US markets close in Indian time?
At 1:30 AM Indian time during US daylight saving time and at 2:30 AM otherwise.
3. What is the difference between a price index and a total return index?
A price index tracks only price changes, and a total return index adds reinvested dividends.
4. How does the rupee affect returns on US indices?
The return in rupees combines the dollar return and the change in the exchange rate. A weaker rupee adds to the return, and a stronger rupee reduces it.
5. Which US indices are the most useful to track?
The S&P 500 for the broad market and the Nasdaq-100 for technology, with the Dow and the Russell 2000 as additional views.
Investments in securities are subject to market risks. Read all related documents carefully. Index levels shown by third-party sources can be delayed.