Top news
Net inflows into open-ended equity mutual funds stood at Rs 4,609 crore in June 2021, compared to inflows of Rs 9,235 crore in the previous month.
The net asset under management (AUM) for the mutual fund industry rose to an all-time high of Rs 33.67 lakh crore at June end.
Navi MF and Kotak MF have launched the NFOs for Navi Nifty 50 Index Fund and Kotak Global Innovation Fund Of Fund
Index Returns
| Index | 1W | 1Y | 3Y | P/E | P/B |
|---|---|---|---|---|---|
| NIFTY 50 | -0.2% | 45.0% | 13.1% | 28.3 | 4.2 |
| NIFTY NEXT 50 | 1.0% | 48.0% | 11.1% | 30.8 | 5.2 |
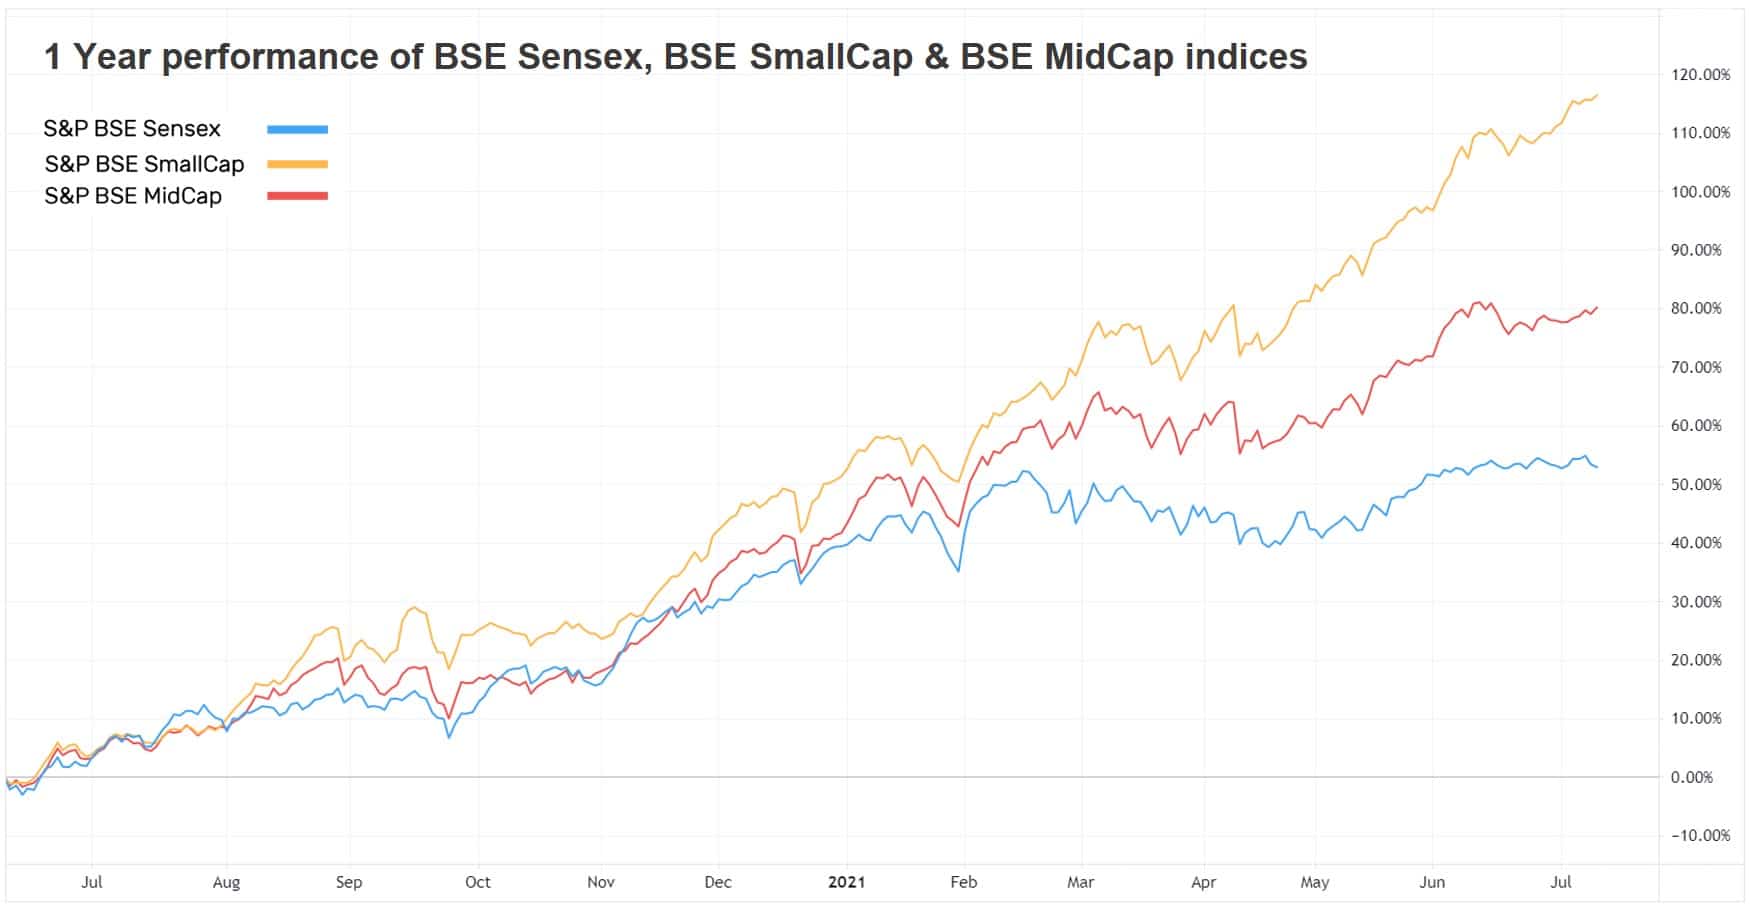
| S&P BSE SENSEX | -0.2% | 42.5% | 13.4% | 31.8 | 3.4 |
| S&P BSE SmallCap | 1.2% | 101.1% | 16.6% | 49.5 | 3.2 |
| S&P BSE MidCap | 1.4% | 68.9% | 13.6% | 43.0 | 3.1 |
| NASDAQ 100 | 0.7% | 37.8% | 26.7% | 38.6 | 9.0 |
| S&P 500 | 0.4% | 38.5% | 16.2% | 30.7 | 4.7 |

Best Performers
| Mutual Funds | 1W | 1Y | 3Y |
|---|---|---|---|
| Nippon India Strategic Debt | 13.8% | 15.9% | -3.6% |
| Nippon India Credit Risk | 6.2% | 15.6% | 3.6% |
| ABSL Infrastructure | 2.8% | 79.1% | 13.60% |
| Edelweiss Recently Listed Ipo | 2.7% | 73.1% | 22.6% |
| IPRU Smallcap | 2.7% | 107.3% | 22.9% |
| ELSS Tax Saving Funds | 1W | 1Y | 3Y |
|---|---|---|---|
| Quant Tax | 1.5% | 117.2% | 32.2% |
| L&T Tax Advantage | 1.3% | 53.1% | 10.8% |
| Edelweiss Long Term Equity | 1.2% | 53.2% | 13.80% |
| DSP Tax Saver | 1.0% | 62.1% | 19.50% |
| 0.9% | 56.2% | 17.0% |
| Stocks (Top 200 by market cap) | 1W | 1Y | 5Y |
|---|---|---|---|
| Godrej Consumer Products | 8.4% | 38.5% | 12.6% |
| Bajaj Finserv | 8.1% | 99.4% | 41.1% |
| Gland Pharma | 8.0% | NA | NA |
| DLF | 7.1% | 105.0% | 14.80% |
| 6.8% | 85.9% | 8.7% |
Worst Performers
| Mutual Funds | 1W | 1Y | 3Y |
|---|---|---|---|
| -5.6% | 30.5% | 26.2% | |
| HSBC Brazil | -5.0% | 17.8% | 5.8% |
| Kotak Global Emerging Market | -4.0% | 26.7% | 13.00% |
| HSBC Global Emerging Market | -3.8% | 27.7% | 14.3% |
| -3.7% | 23.9% | 13.9% |
| Stocks (Top 200 by market cap) | 1W | 1Y | 5Y |
|---|---|---|---|
| Tata Motors Ltd | -11.0% | 190.5% | -8.0% |
| NMDC Ltd | -9.2% | 97.5% | 15.5% |
| Tata Motors Ltd Class A | -8.2% | 239.7% | -13.6% |
| Adani Gas Ltd | -5.4% | 493.3% | NA |
| Union Bank of India | -5.0% | 13.1% | -22.3% |
Bought and Sold
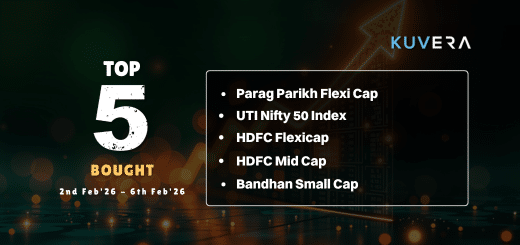
| Bought on kuvera.in | 1W | 1Y | 3Y |
|---|---|---|---|
| Parag Parikh Flexi Cap | 1.0% | 55.9% | 22.2% |
| Quant Small Cap | 2.2% | 186.3% | 33.8% |
| UTI Nifty Index | -0.2% | 46.5% | 14.1% |
| Axis Bluechip | 0.2% | 43.2% | 16.3% |
| -0.3% | 125.2% | 34.0% |
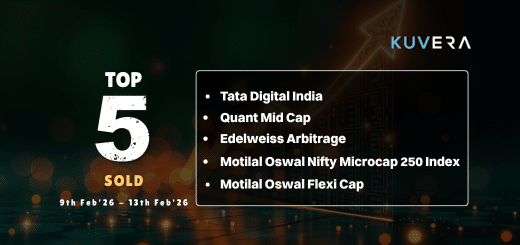
| Sold on kuvera.in | 1W | 1Y | 3Y |
|---|---|---|---|
| 2.5% | 100.1% | 13.4% | |
| IIFL Focused Equity | 0.2% | 60.5% | 24.0% |
| Tata Equity PE | -0.2% | 41.70% | 9.70% |
| UTI Arbitrage | 0.0% | 4.5% | 5.8% |
| 1.3% | 40.6% | 9.90% |
Most Watchlisted
Mutual Fund Watchlist | 1W | 1Y | 3Y |
|---|---|---|---|
| Quant Small Cap | 2.2% | 186.3% | 33.8% |
| Parag Parikh Flexi Cap | 1.0% | 55.9% | 22.2% |
| IPRU Technology | -0.3% | 125.2% | 34.0% |
| Mirae Asset Emerging Bluechip | 0.2% | 65.3% | 23.4% |
| -1.0% | 106.2% | 31.2% |
Stocks Watchlist | 1W | 1Y | 5Y |
|---|---|---|---|
| Reliance Industries | -1.2% | 15.3% | 34.1% |
| Adani Green Energy | -4.1% | 159.0% | NA |
| Infosys | 0.1% | 101.7% | 23.5% |
| Tata Motors | -11.0% | 190.5% | -8.0% |
| -4.0% | 44.6% | 22.9% |
US Stocks Watchlist | 1W | 1Y | 5Y |
|---|---|---|---|
| Apple | 3.7% | 51.3% | 43.1% |
| Tesla | -3.2% | 112.2% | 72.2% |
| Amazon.com | 5.9% | 16.2% | 37.9% |
| Microsoft Corporation | 0.1% | 30.0% | 39.7% |
| -1.2% | 43.0% | 24.5% |
Data Source: NSE, BSE & Kuvera.in
Interested in how we think about the markets?
Read more: Zen And The Art Of Investing
Watch/hear on YouTube:
Start investing through a platform that brings goal planning and investing to your fingertips. Visit kuvera.in to discover Direct Plans and start investing today.
#MutualFundSahiHai, #KuveraSabseSahiHai!


