


Gaurav here [GR] – Kuvera is where the smart investors are. Some such investors have formed a collective – “The Watchmen”.
Inspired by the comic book, this is a collective based on the scientific method – to test all hypothesis and let the data speak. A true ‘watchmen’ against all that is passed as investing advice.
This is their first blog. If you like it share it with friends. Enjoy!
One of the most common mistakes that investors do when it comes to investing is to chase past performance. Most investors sort mutual funds based on past 1 year, 3 years or 5-year returns and pick the top-performing funds in one or more of the above categories. A lot of distributors do the same as it is an easy sell.
But does it make investment sense? Do the best performing funds based on past data continue to be the best performing funds in the future?
While choosing mutual funds based on past performance may seem like a remarkably simple and intuitive way of assessing the mutual funds, there is enormous empirical evidence, that there is little persistence in the past performance. This implies that there is a good chance that the best fund(s) based on past performance today may not be the best fund(s) one or two years later. Very few investors constantly monitor their investments and even for those who do monitor their investments, chasing of best funds then becomes a never-ending ritual. To make things worse, almost all the commercial mutual fund distributor platforms and online advisors show a star rating system that is supposedly designed to help the investors choose the “best” funds.
How do they assign star ratings? You may have guessed it right – Past performance. [GR: ratings don’t work either. See here]
In this short note, we assess the persistence (or the lack of it) of mutual fund performance using a methodology introduced by an eminent research scholar, Mark Carhart in his 1997 articles titled “On the persistence of mutual fund performance”[1] published in The Journal of Finance. Carhart looked at the mutual fund universe of USA and we decided to replicate the same results in the Indian mutual fund universe.
Let us imagine a fictitious investor “Appu” who decided to invest in mutual funds.
He logs in to his favourite mutual fund portal. He sorts the funds based on past 1-year performance and decides to invest in the top 10% of the funds. Now a year later, what percentage of those funds do you think still remain in the top 10%? Ideally, he would hope to see 100% of his funds continue to be the best. But what percentage do you think he is likely to see in reality?
We ranked all the “Regular growth equity” mutual funds into deciles (10 equally sized groups) sorted by their past performance*. We looked at three different past performances – 1 year, 3 years and 5 years. Then we tried to emulate Appu, our typical investor’s behaviour. Appu would pick his funds from the winning decile – the group of funds that ranked in the top 10% in terms of past performance. We then calculated what percentage of funds continued to remain the same decile group or moved to different decile groups just one year later based on the one-year realized returns (i.e the returns investors would have earned 1 year later).
So, let’s see how Appu’s fund did. Appu invested based on the best 1-year past performance.
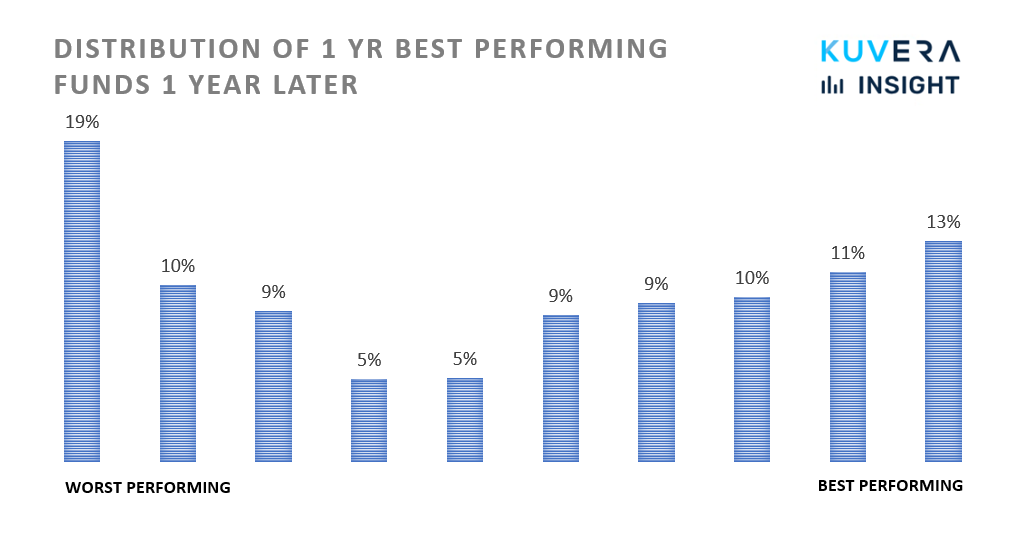

Let’s spend some time on this chart because what it says is nothing short of revolutionary.
1/ 19% of the best performing funds (top decile) based on 1 year past data were part of the worst-performing funds 1 year later.
2/ A mere 13% of the best performing funds based on 1 year past data continued to be part of the best performing funds 1 year later.
3/ Only 52% of the best performing funds based on 1 year past data continue to be in the top half of the funds by performance 1 year later.
Let that sink in.
And then the first reaction comes from Appu distributor. Hey, but 1 year is too short a time period. Wait for 5 years, look for consistent performers. Haven’t you heard the phrase “consistent performers” before!
Sure, let’s do that next. Let’s look at selecting funds on past 5-year performance and see how they are placed 1 year later. So we look at the top 10% of best performing fund over the past 5 years and see where they end up 1 year later – are they still in the top 10% of best-performing funds or does that change.
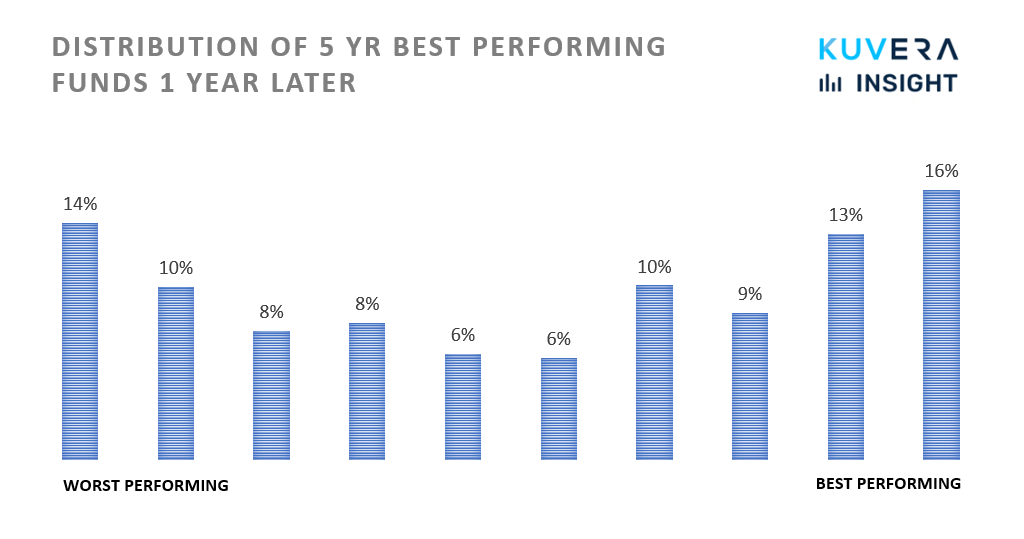

Not much to see here either. “Consistent performance” – ah now that’s another myth that’s busted. We would show you the 3-year data as well, but trust us it is more of the same. Won’t bring any comfort to your sore eyes.
But, why should only the top 10% performing funds have all the fun. What happens to the worst 10% performing funds based on past data? That’s something worth looking too. Does it make sense to avoid the worst 10% performing funds based on past performance?
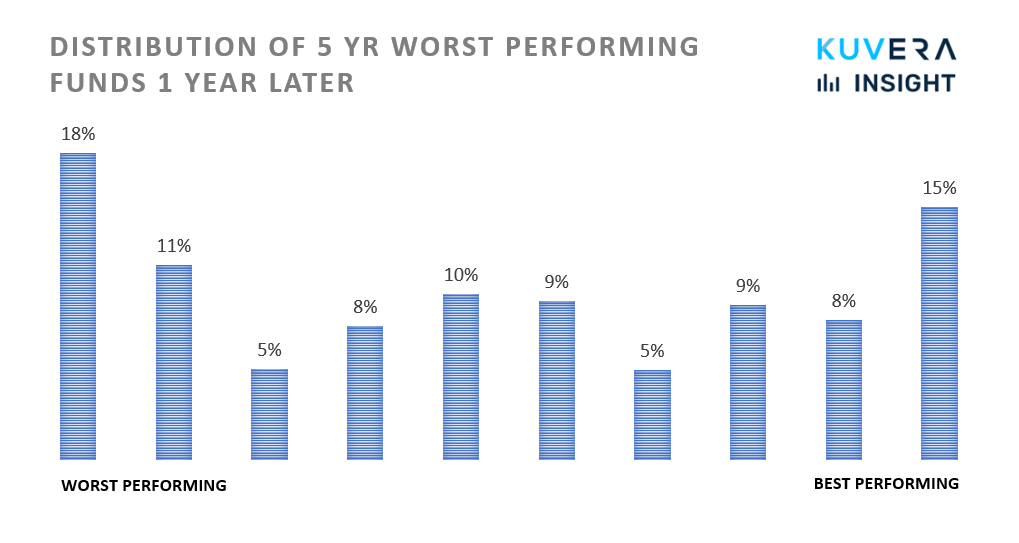

Doesn’t this look more or less the same as the top 10% funds based on past 5-year performance? Yeah, it does. So no persistence in best performing funds, and no persistence in worst-performing funds either.
Guess what, we might have just thrown darts and picked the funds or you know done the smart thing and invested in index funds and saved time.
In a nutshell, there is truly little persistence in rankings. Based on past 1-year performances, more of the best funds end up in the worst (loser) decile (nearly 19%) than those that remain as winners (nearly 13%). Nearly 15% of the funds that belonged to the loser decile ended up in the winner decile just a year later. Persistence seems to be slightly stronger in the loser decile than in the winner decile. Around 1% of the loser funds disappeared in the subsequent year. Remarkably similar patterns can be observed in the 3-year and 5-years lookback periods.
What we saw is average data across years. Even on a year on year basis the persistence for both winner and losers reaches at best 20%. What it implies is that at best only 1 in 5 of the funds that an investor picked based on past performance is likely to remain best and the other 4 can potentially be bad, worse or the absolute worst.
Carhart concluded the same in the US mutual fund universe. And guess what it applies equally to all kinds of active management – hedge funds, PMS, thematic baskets, ETFs etc etc… you get the drift!
Buy them on past performance, repent on future performance.
Note on Methodology:
We downloaded the entire AMFI return data set going back to 2003. That’s 16 years of data. Every year we look at the entire universe of funds and divide them into 10 groups (called deciles) based on past returns. We use three parameters for past returns – 1-year past return, 3-year past return and 5-year past return. Each group will have 10% of the total number of funds. Then we look at the top 10% best performing funds in that year, i.e the top decile and see where the funds in that decile end up a year later. We repeat this exercise every year to see where the top 10% of funds based on past performance end up one year later. The data shown in the charts averages across all such annual experiments to arrive at expected values.
[1] Carhart, Mark M. “On persistence in mutual fund performance.” The Journal of finance 52, no. 1 (1997): 57-82.
Opinions expressed are the authors and should not be construed as investment advice from Kuvera.
Interested in how we think about the markets?
Read more: Zen And The Art Of Investing
Watch/hear on YouTube:

Start investing through a platform that brings goal planning and investing to your fingertips. Visit kuvera.in to discover Direct Plans and start investing today.
#MutualFundSahiHai, #KuveraSabseSahiHai!