Top news
SEBI in a circular has introduced a swing pricing mechanism for open-ended debt mutual fund schemes beginning March 2022. Overnight funds, Gilt funds, and Gilt funds with 10-year maturity are excluded.
GST collection for September 2021 surpassed Rs. 1.17 lakh crore mark, a 23% jump in comparison to the same month last year.
Shares of Paras Defence got listed at a premium of 171% over the issue price of Rs 175 and the IPO of Aditya Birla Sun Life AMC got oversubscribed 5 times.
Index Returns
| Index | 1W | 1Y | 3Y | P/E | P/B |
|---|---|---|---|---|---|
| NIFTY 50 | -1.8% | 53.4% | 16.8% | 26.8 | 4.4 |
| NIFTY NEXT 50 | -1.3% | 55.9% | 15.9% | 26.3 | 4.4 |
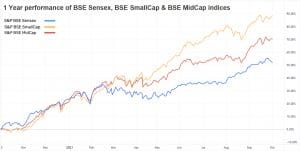
| S&P BSE SENSEX | -2.1% | 51.7% | 17.2% | 30.7 | 3.8 |
| S&P BSE SmallCap | 0.7% | 88.2% | 25.1% | 44.3 | 3.4 |
| S&P BSE MidCap | 0.1% | 70.1% | 19.3% | 33.4 | 3.4 |
| NASDAQ 100 | -3.5% | 27.6% | 24.6% | 34.5 | 8.7 |
| S&P 500 | -2.2% | 28.8% | 14.2% | 26.1 | 4.6 |

Best Performers
| Mutual Funds | 1W | 1Y | 3Y |
|---|---|---|---|
| IDBI Credit Risk | 9.8% | 19.0% | 3.0% |
| IDBI Short Term Bond | 7.8% | 13.8% | 8.5% |
| Baroda Credit Risk B | 7.2% | 22.1% | 8.9% |
| UTI Credit Risk | 6.4% | 22.9% | -4.9% |
| 4.9% | 63.5% | 10.0% |
| ELSS Tax Saving Funds | 1W | 1Y | 3Y |
|---|---|---|---|
| ITI Long Term Equity | 0.5% | 53.7% | NA |
| Quant Tax | -0.2% | 89.4% | 34.7% |
| Franklin India Taxshield | -0.2% | 70.4% | 17.1% |
| Navi Long Term Advantage | -0.4% | 49.6% | 17.2% |
| -0.5% | 75.6% | 22.0% |
| Stocks (Top 200 by market cap) | 1W | 1Y | 5Y |
|---|---|---|---|
| IDBI Bank | 28.4% | 43.9% | -6.1% |
| Tata Power | 14.0% | 208.1% | 17.8% |
| Tata Motors DVR | 13.3% | 197.1% | -11.3% |
| Indus Towers | 13.0% | 80.0% | 1.3% |
| 12.7% | 62.6% | -3.8% |
Worst Performers
| Mutual Funds | 1W | 1Y | 3Y |
|---|---|---|---|
| PGIM India Global Equity Opp.. | -6.2% | 24.6% | 28.7% |
| HSBC Brazil | -5.6% | 13.4% | -2.4% |
| IPRU Technology | -5.0% | 94.0% | 36.9% |
| SBI Technology Opp.. | -4.9% | 80.8% | 32.8% |
| -4.8% | 92.3% | 35.3% |
| Stocks (Top 200 by market cap) | 1W | 1Y | 5Y |
|---|---|---|---|
| Apollo Hospitals | -12.5% | 107.5% | 27.6% |
| InterGlobe Aviation | -10.8% | 58.1% | 17.1% |
| Cummins India | -10.7% | 106.1% | 3.3% |
| Tech Mahindra | -9.8% | 73.2% | 28.7% |
| -9.5% | 29.2% | NA |
Bought and Sold
| Bought on kuvera.in | 1W | 1Y | 3Y |
|---|---|---|---|
| Parag Parikh Flexi Cap | -2.0% | 57.6% | 27.6% |
| IDFC Arbitrage | 0.0% | 4.3% | 5.5% |
| Tata Digital India | -4.8% | 92.3% | 35.3% |
| IPRU Technology | -5.0% | 94.0% | 36.9% |
| 1.0% | NA | NA |
| Sold on kuvera.in | 1W | 1Y | 3Y |
|---|---|---|---|
| ABSL Arbitrage | 0.0% | 4.6% | 5.6% |
| IPRU Bluechip | -1.4% | 57.1% | 17.3% |
| Nippon India Gold Saving | 0.4% | -8.9% | 13.9% |
| ABSL Frontline Equity | -1.6% | 58.5% | 17.6% |
| 0.9% | 14.1% | 22.8% |
Most Watchlisted
Mutual Fund Watchlist | 1W | 1Y | 3Y |
|---|---|---|---|
| IPRU Commodities | 2.6% | 130.4% | NA |
| Tata Digital India | -4.8% | 92.3% | 35.3% |
| Parag Parikh Flexi Cap | -2.0% | 57.6% | 27.6% |
| IPRU Technology | -5.0% | 94.0% | 36.9% |
| 0.8% | 117.6% | 37.7% |
Stocks Watchlist | 1W | 1Y | 5Y |
|---|---|---|---|
| Reliance Industries | 1.3% | 12.9% | 36.6% |
| Adani Green Energy | 0.3% | 56.0% | NA |
| Tata Motors | 3.7% | 150.1% | -9.0% |
| Infosys | -4.4% | 65.2% | 27.7% |
| -3.6% | 49.7% | 26.4% |
US Stocks Watchlist | 1W | 1Y | 5Y |
|---|---|---|---|
| Tesla | 0.1% | 86.8% | 80.2% |
| Apple | -2.9% | 27.0% | 40.0% |
| Amazon.com | -4.2% | 5.1% | 31.4% |
| Microsoft Corporation | -3.4% | 41.5% | 40.2% |
| -10.4% | NA | NA |
Data Source: NSE, BSE & Kuvera.in
Interested in how we think about the markets?
Read more: Zen And The Art Of Investing
Watch/hear on YouTube:
Start investing through a platform that brings goal planning and investing to your fingertips. Visit kuvera.in to discover Direct Plans and start investing today.
#MutualFundSahiHai, #KuveraSabseSahiHai!


