Top news
Open ended equity mutual funds witnessed inflows of Rs 18,529 crore in May 2022. The net Asset Under Management (AUM) of the Mutual Fund industry stood at Rs 37.02 lakh crore.
SIP inflows stood at Rs 12,286 crore in May 2022, a jump of 39 % compared to inflows of Rs 8819 crore in the same month last year. Total number of SIP folios jumped to 5.48 crore in May 2022 from 5.39 crore in April.
RBI’s MPC hiked the repo rate by 50 basis points to 4.9% and revised the estimate of real GDP growth to 7.2% in FY23 while inflation is now projected at 6.7%
IPO of Silver Pearl Hospitality got oversubscribed by 1.68 times.
Index Returns
| Index | 1W | 1Y | 3Y | P/E | P/B |
|---|---|---|---|---|---|
| NIFTY 50 | -2.3% | 3.0% | 11.0% | 20.1 | 4.1 |
| NIFTY NEXT 50 | -1.6% | -4.0% | 11.2% | 18.9 | 4.0 |
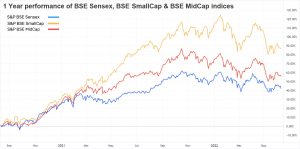
| S&P BSE SENSEX | -2.6% | 3.8% | 10.9% | 22.1 | 3.1 |
| S&P BSE SmallCap | -2.0% | 3.4% | 21.0% | 35.4 | 2.9 |
| S&P BSE MidCap | -1.3% | -1.7% | 14.7% | 20.8 | 2.6 |
| NASDAQ 100 | -5.6% | -14.3% | 16.8% | 24.8 | 6.3 |
| S&P 500 | -5.1% | -8.2% | 10.7% | 19.5 | 3.9 |

Best Performers
| Mutual Funds | 1W | 1Y | 3Y |
|---|---|---|---|
| Mirae Asset NYSE FANG ETF FoF | 6.7% | -15.2% | NA |
| PGIM India Emerging Markets Equity | 2.0% | -33.9% | -0.3% |
| 1.0% | -26.2% | 18.3% | |
| Franklin Asian Equity | 0.9% | -18.90.% | 7.2% |
| 0.7% | -10.7% | 11.8% |
| ELSS Tax Saving Funds | 1W | 1Y | 3Y |
|---|---|---|---|
| ITI Long Term Equity | -1.0% | -8.8% | NA |
| HDFC Tax Saver | -1.2% | 12.8% | 11.2% |
| Quantum Tax Saving | -1.3% | -0.1% | 9.4% |
| Parag Parikh Tax Saver | -1.4% | 13.5% | NA |
| -1.5% | 3.1% | 16.1% |
| Stocks (Market cap > Rs 50k Cr) | 1W | 1Y | 5Y |
|---|---|---|---|
| ONGC | 8.0% | 32.7% | 2.5% |
| Macrotech Developers | 6.1% | 64.4% | NA |
| Bajaj Auto | 5.2% | -8.0% | -8.4% |
| IPRU Life Insurance Co | 2.5% | -2.7% | 5.8% |
| 2.4% | -17.6% | 6.1% |
Worst Performers
| Mutual Funds | 1W | 1Y | 3Y |
|---|---|---|---|
| HSBC Brazil | -13.0% | 19.8% | -7.0% |
| Motilal Oswal Midcap | -3.6% | 13.5% | 27.0% |
| IDBI Healthcare | -2.7% | -8.0% | 20.7% |
| SBI Healthcare Opportunities | -2.3% | 0.3% | 26.1% |
| Union Small Cap | -2.3% | 5.5% | 31.9% |
| Stocks (Market cap > Rs 50k Cr) | 1W | 1Y | 5Y |
|---|---|---|---|
| Shree Cement | -11.4% | -32.5% | 2.1% |
| -9.3% | -23.8% | NA | |
| Adani Green Energy | -8.7% | 40.9% | NA |
| -8.3% | -18.1% | 6.2% | |
| Grasim Industries | -7.4% | -11.1% | 7.5% |
Bought and Sold
| Bought on kuvera.in | 1W | 1Y | 3Y |
|---|---|---|---|
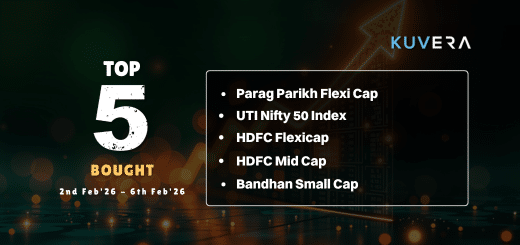
| Parag Parikh Flexi Cap | -2.2% | 9.0% | 23.0% |
| UTI Nifty Index | -2.3% | 4.0% | 11.8% |
| Axis Bluechip | -2.5% | -2.6% | 11.6% |
| UTI Nifty Next 50 Index | -1.5% | -3.3% | 11.8% |
| -2.1% | 2.8% | 19.8% |
| Sold on kuvera.in | 1W | 1Y | 3Y |
|---|---|---|---|
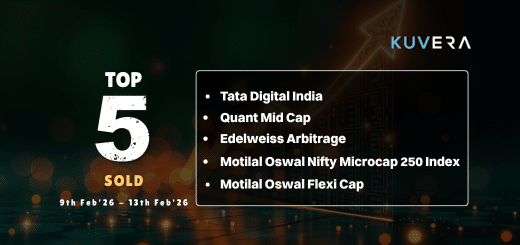
| HDFC Flexicap | -1.2% | 10.3% | 13.4% |
| Quantum Long Term Equity Value | -1.3% | -0.5% | 9.2% |
| Kotak Debt Hybrid | -0.6% | 5.0% | 11.5% |
| -0.3% | 3.4% | 10.0% | |
| 0.1% | 4.0% | 4.9% |
Most Watchlisted
Mutual Fund Watchlist | 1W | 1Y | 3Y |
|---|---|---|---|
| Canara Robeco Small Cap | -2.2% | 23.0% | 32.7% |
| Tata Digital India | -2.7% | 10.0% | 28.7% |
| Parag Parikh Flexi Cap | -2.2% | 9.0% | 23.0% |
| Quant Small Cap | -0.9% | 12.8% | 39.7% |
| -2.7% | 5.3% | 30.3% |
Stocks Watchlist | 1W | 1Y | 5Y |
|---|---|---|---|
| Reliance Industries | -0.4% | 24.8% | 33.1% |
| Adani Green Energy | -8.7% | 40.9% | NA |
| Tata Motors | -2.5% | 24.7% | -1.1% |
| Infosys | -2.1% | 4.4% | 28.0% |
| -1.8% | 5.2% | 23.5% |
US Stocks Watchlist | 1W | 1Y | 5Y |
|---|---|---|---|
| Meta Platforms | -8.0% | -40.8% | 5.7% |
| Microsoft Corporation | -6.3% | -0.9% | 30.8% |
| Apple | -5.7% | 9.4% | 31.2% |
| Tesla | -1.0% | 14.3% | 57.6% |
| -10.4% | -34.5% | 17.5% |
Data Source: NSE, BSE & Kuvera.in
Interested in how we think about the markets?
Read more: Zen And The Art Of Investing
Watch/hear on YouTube:
Start investing through a platform that brings goal planning and investing to your fingertips. Visit kuvera.in to discover Direct Plans and Fixed Deposits and start investing today.
This market update was initially published by Livemint.
#MutualFundSahiHai, #KuveraSabseSahiHai!


