


Top news
India’s mutual fund SIP investments reached a record ₹32,490 crore in September 2026, while equity mutual fund inflows rose 31% to ₹38,307 crore, reflecting continued investor participation despite market volatility.
IPO Update: On the final day (23 October 2026), Jio Platforms IPO was subscribed 21.33 times, led by QIB demand at 67.15 times. Paras Healthcare IPO closed with 2.34 times subscription, with QIBs at 3.25 times and retail investors at 2.10 times.
NFO Update: AMCs have launched several new schemes, including Axis Nifty EV & New Age Automotive Index Fund, Navi Multi Asset Omni FoF, Samco Equity Savings Fund, Choice Large & Mid Cap Fund, Motilal Oswal Multi Asset Omni FoF, and UTI Nifty India New Age Consumption Index Fund.
Index Returns
| Index | 1W | 1Y | 3Y | P/E | P/B |
|---|---|---|---|---|---|
| NIFTY 50 | -2.4% | -12.7% | 4.9% | 19.1 | 2.8 |
| NIFTY NEXT 50 | -4.6% | -5.2% | 13.8% | 17.1 | 3.2 |
| S&P BSE SENSEX | -2.2% | -13.5% | 8.9% | 20.4 | 3.2 |
| S&P BSE SMALLCAP | -6.2% | -12.7% | 21.8% | 40.4 | 4.6 |
| S&P BSE MIDCAP | -5.1% | -5.3% | 21.7% | 37.5 | 6.0 |
| NASDAQ 100 | -0.8% | 14.2% | 12.7% | 28.0 | 4.8 |
| S&P 500 | -0.5% | 12.3% | 10.4% | 26.0 | 6.1 |


Best Performers
| Mutual Funds | 1W | 1Y | 3Y |
|---|---|---|---|
| Groww Nifty 200 ETF FoF | 3.4% | -4.9% | NA |
| Baroda BNP Paribas Funds Aqua FoF | 1.4% | 11.0% | 18.1% |
| Quant Arbitrage Growth | 0.4% | 7.90% | NA |
| Nippon India Nifty IT Index Growth | 0.3% | -9.70% | NA |
| DSP Nifty IT Index Growth | 0.3% | -9.30% | NA |
| A | B | C | D |
|---|---|---|---|
| ELSS Tax Saving Funds | 1W | 1Y | 3Y |
| 360 One ELSS Tax Saver Nifty 50 Index | -2.3% | -11.9% | 6.4% |
| Navi ELSS Tax Saver Nifty 50 Index | -2.4% | -12.0% | 6.4% |
| Parag Parikh ELSS Tax Saver | -2.5% | -13.2% | 8.1% |
| DSP ELSS Tax Saver | -2.7% | -7.9% | 12.4% |
| HDFC ELSS Tax Saver | -2.8% | -11.6% | 11.7% |
| Stocks (Market cap < Rs 50k Cr) | 1W | 1Y | 5Y |
|---|---|---|---|
| Wipro | 9.1% | -21.4% | -1.1% |
| Tech Mahindra | 8.5% | 23.6% | 15.2% |
| Tata Consultancy Services | 7.7% | -15.9% | -10.2% |
| The Indian Hotels Company | 5.4% | 5.0% | 24.5% |
| Punjab National Bank | 4.6% | 2.3% | 18.6% |
Worst Performers
| Mutual Funds | 1W | 1Y | 3Y |
|---|---|---|---|
| Mirae Asset BSE Select IPO ETF FoF Growth | -10.2% | -13.0% | NA |
| DSP Silver ETF FoF Growth | -8.3% | 30.3% | NA |
| UTI Silver ETF FoF Growth | -8.3% | 30.6% | 37.0% |
| SBI Silver ETF FoF Growth | -8.2% | 28.2% | NA |
| HDFC Silver ETF FoF Growth | -8.2% | 29.8% | 36.7% |
| Stocks (Market cap > Rs 50k Cr) | 1W | 1Y | 5Y |
|---|---|---|---|
| Dixon Technologies (India) | -11.7% | -30.6% | 26.6% |
| Mazagon Dock Shipbuilders | -11.6% | -34.3% | 21.5% |
| Siemens | -11.5% | 4.6% | 7.4% |
| Bharat Heavy Electricals | -10.8% | 65.2% | 45.7% |
| NTPC Green Energy | -10.4% | -19.2% | NA |
What Investors Bought
| Most Bought MF | 1W | 1Y | 3Y |
|---|---|---|---|
| Parag Parikh Flexi Cap | -1.3% | -5.7% | 12.2% |
| Invesco India Arbitrage | 0.2% | 7.0% | 7.5% |
| Bandhan Small Cap | -5.4% | 2.3% | 22.1% |
| Altiva Hybrid Long Short | -0.9% | NA | NA |
| Quant Small Cap | -5.7% | 3.8% | 16.4% |
What Investors Sold
| Most sold MF | 1W | 1Y | 3Y |
|---|---|---|---|
| Edelweiss Nifty Smallcap 250 Index | -7.1% | -4.6% | 11.5% |
| Nippon India Nifty IT Index | 0.3% | -9.7% | NA |
| Mirae Asset Large & Midcap | -4.1% | -7.3% | 10.4% |
| UTI Nifty200 Momentum 30 Index | -6.2% | -13.9% | 7.4% |
| Quant Mid Cap | -5.4% | -3.9% | 9.2% |
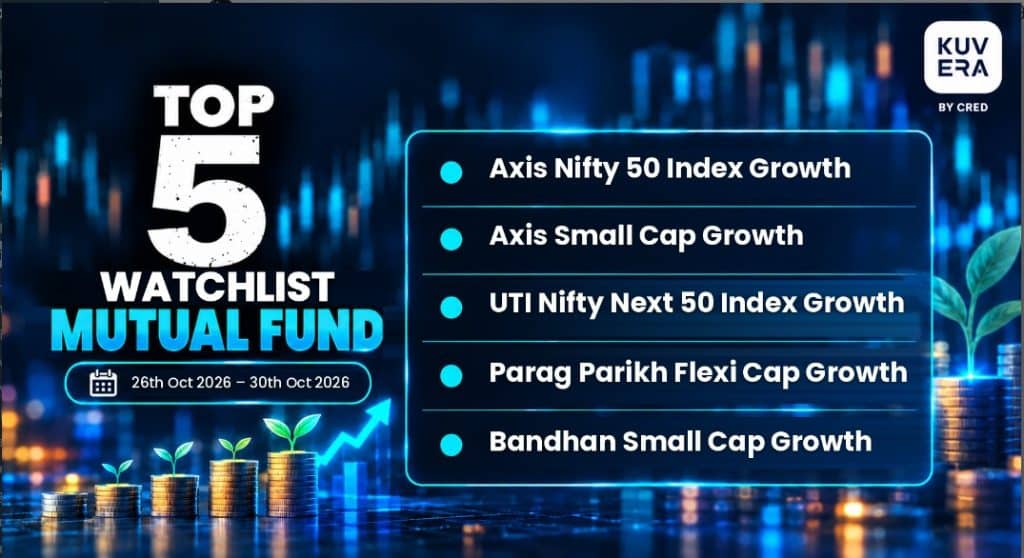
Most Watchlisted
Mutual Fund Watchlist | 1W | 1Y | 3Y |
|---|---|---|---|
| Axis Nifty 50 Index Growth | -2.4% | -11.9% | 6.5% |
| Axis Small Cap Growth | -5.3% | 0.5% | 12.9% |
| UTI Nifty Next 50 Index Growth | -4.6% | -4.6% | 15.3% |
| Parag Parikh Flexi Cap Growth | -1.6% | -5.7% | 12.2% |
| Bandhan Small Cap Growth | -5.4% | 2.3% | 22.1% |
Stocks Watchlist | 1W | 1Y | 5Y |
|---|---|---|---|
| Laurus Labs | -4.4% | 113.2% | -31.1% |
| Bharat Heavy Electricals | -10.9% | 65.2% | 42.1% |
| The Federal Bank | 1.8% | 49.9% | 27.8% |
| AU Small Finance Bank | -6.0% | 8.3% | 10.2% |
| Amara Raja Energy & Mobility | -7.2% | -31.1% | 1.2% |
US Stocks Watchlist | 1W | 1Y | 5Y |
|---|---|---|---|
| SanDisk Corp | -9.7% | 601.5% | NA |
| Micron Technology Inc. | -3.0% | 298.7% | 67.0% |
| Advanced Micro Devices, Inc. | -4.0% | 99.0% | 33.9% |
| Oracle Corp. | -2.7% | -55.2% | 5.2% |
| AppLovin Corp. | -3.3% | -59.5% | 22.6% |
Data Source: NSE, BSE & Kuvera.in
Strategies for navigating Market Cycles.
Watch/hear on YouTube:

Start investing through a platform that brings goal planning and investing to your fingertips. Visit kuvera.in to discover Direct Plans and Fixed Deposits and start investing today.
Disclaimer: Mutual Fund investments are subject to market risks. Read all scheme related documents carefully.
Registration granted by SEBI, membership of IAASB (in case of IAs) and certification from NISM in no way guarantee performance of the intermediary or provide any assurance of returns to investors.
Investment in the securities is subject to market risks. Read all the related documents carefully before investing.
The securities quoted are for illustration only and are not recommendatory.
This market update was initially published by Livemint.
#MutualFundSahiHai, #KuveraSabseSahiHai!


