Top news
SEBI chairman Ajay Tyagi stated in a press conference that the NFOs based on crypto assets should not be released until the government has announced regulations for cryptocurrencies.
India’s fiscal deficit in the first eight months of FY22 narrowed to 46.2% of annual budget target. The deficit stood at Rs 6.96 lakh crore at the end of November 2021.
Shares of Supriya Lifescience, HP Adhesives and CMS Info Systems, got listed at a premium of 53%, 14% and 2% over issue price of Rs 274, Rs 274 and Rs 216 respectively.
ICICI MF has launched the NFO for ICICI Prudential Passive Multi Asset FOF. The NFO closes on January 10.
Index Returns
| Index | 1W | 1Y | 3Y | P/E | P/B |
|---|---|---|---|---|---|
| NIFTY 50 | 2.1% | 24.1% | 16.9% | 24.1 | 4.4 |
| NIFTY NEXT 50 | 1.7% | 29.8% | 14.4% | 22.9 | 4.3 |
| S&P BSE SENSEX | 2.0% | 21.9% | 17.3% | 27.9 | 3.6 |
| S&P BSE SmallCap | 3.8% | 62.6% | 26.0% | 46.0 | 3.4 |
| S&P BSE MidCap | 2.5% | 39.1% | 17.4% | 27.6 | 3.1 |
| NASDAQ 100 | 0.1% | 26.6% | 37.1% | 40.0 | 9.3 |
| S&P 500 | 0.9% | 26.8% | 23.9% | 26.3 | 4.9 |
Best Performers
| Mutual Funds | 1W | 1Y | 3Y |
|---|---|---|---|
| Tata India Pharma & Healthcare | 5.7% | 20.9% | 29.3% |
| Nippon India Pharma | 5.6% | 25.1% | 29.1% |
| IPRU Pharma Healthcare... | 5.5% | 19.3% | 30.0% |
| Mirae Asset Healthcare | 5.5% | 28.6% | 35.0% |
| 5.5% | 20.3% | 27.6% |
| ELSS Tax Saving Funds | 1W | 1Y | 3Y |
|---|---|---|---|
| L&T Tax Advantage | 3.0% | 31.2% | 16.4% |
| BOI AXA Tax Advantage | 3.0% | 42.9% | 30.0% |
| Baroda Elss 96 B | 2.8% | 40.6% | 20.9% |
| Mahindra Manulife Elss... | 2.7% | 41.8% | 20.5% |
| 2.7% | 50.9% | 23.2% |
| Stocks (Top 200 by market cap) | 1W | 1Y | 5Y |
|---|---|---|---|
| Titan | 8.4% | 62.4% | 50.8% |
| HCL | 7.4% | 40.1% | 27.2% |
| 6.9% | 74.9% | 25.5% | |
| Sun Pharma | 6.7% | 44.7% | 6.5% |
| 6.6% | 113.5% | 44.4% |
Worst Performers
| Mutual Funds | 1W | 1Y | 3Y |
|---|---|---|---|
| DSP Natural Resources & New... | -1.3% | 43.2% | 19.4% |
| HSBC Global Emerging Markets | -1.0% | -3.2% | 15.3% |
| Kotak Global Emerging Market | -0.9% | -0.3% | 16.7% |
| Nippon India US Equity Opp... | -0.8% | 24.9% | 27.4% |
| -0.7% | 5.1% | 14.6% |
| Stocks (Top 200 by market cap) | 1W | 1Y | 5Y |
|---|---|---|---|
| Adani Green Energy | -6.4% | 26.6% | NA |
| Adani Transmission | -4.5% | 296.3% | 98.3% |
| Macrotech Developers | -3.3% | NA | NA |
| IDBI Bank | -3.0% | 50.4% | -7.7% |
| -2.8% | 5.0% | 4.5% |
Bought and Sold
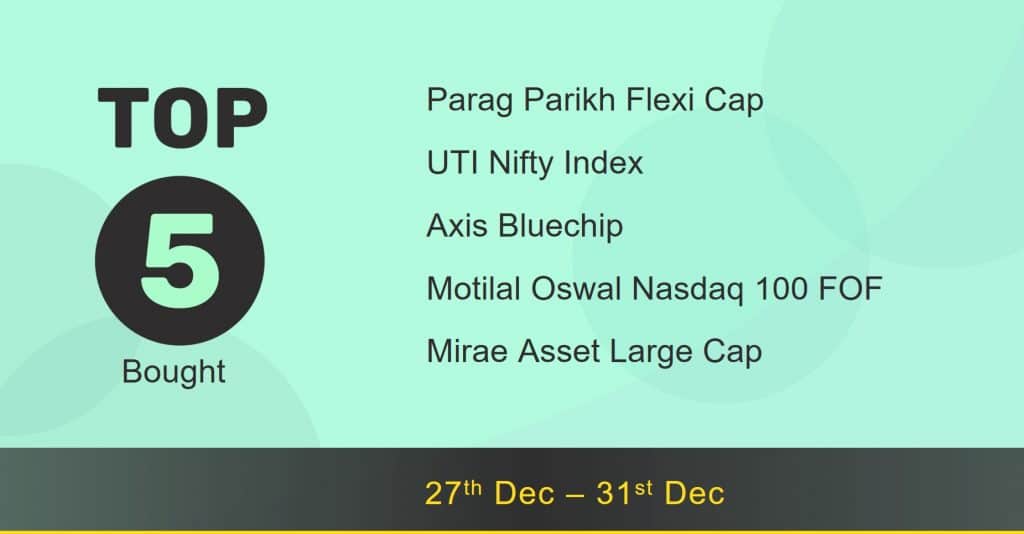
| Bought on kuvera.in | 1W | 1Y | 3Y |
|---|---|---|---|
| Parag Parikh Flexi Cap | 1.9% | 47.0% | 31.3% |
| UTI Nifty Index | 2.1% | 25.3% | 18.0% |
| Axis Bluechip | 2.0% | 22.1% | 21.1% |
| Motilal Oswal Nasdaq 100 FOF | 0.0% | 29.0% | 39.4% |
| 2.2% | 29.1% | 19.2% |
| Sold on kuvera.in | 1W | 1Y | 3Y |
|---|---|---|---|
| Kotak Balanced Advantage | 0.8% | 14.4% | 14.2% |
| Edelweiss Balanced Advantage | 1.2% | 20.4% | 17.9% |
| IPRU Commodities | 2.5% | 72.7% | NA |
| Quantum Long Term Equity Value | 2.3% | 25.5% | 12.1% |
| 2.6% | 31.4% | 19.0% |
Most Watchlisted
Mutual Fund Watchlist | 1W | 1Y | 3Y |
|---|---|---|---|
| Tata Digital India | 2.6% | 77.3% | 45.1% |
| Parag Parikh Flexi Cap | 1.9% | 47.0% | 31.3% |
| IPRU Technology | 2.6% | 77.8% | 46.6% |
| Quant Small Cap | 3.0% | 91.7% | 37.4% |
| 2.1% | 25.3% | 18.0% |
Stocks Watchlist | 1W | 1Y | 5Y |
|---|---|---|---|
| Reliance Industries | 0.1% | 18.7% | 35.0% |
| Adani Green Energy | -6.4% | 26.6% | NA |
| Tata Motors | 2.1% | 162.1% | 0.5% |
| Infosys | 1.6% | 51.6% | 31.6% |
| 2.0% | 28.5% | 27.2% |
US Stocks Watchlist | 1W | 1Y | 5Y |
|---|---|---|---|
| Tesla | 0.1% | 51.3% | 90.3% |
| Microsoft Corporation | 0.7% | 34.6% | 45.5% |
| Apple | 0.5% | 52.5% | 42.2% |
| Amazon.com | -1.3% | 3.6% | 35.1% |
| 1.8% | 24.9% | 24.3% |
Data Source: NSE, BSE & Kuvera.in
Interested in how we think about the markets?
Read more: Zen And The Art Of Investing
Watch/hear on YouTube:
Start investing through a platform that brings goal planning and investing to your fingertips. Visit kuvera.in to discover Direct Plans and Fixed Deposits and start investing today.
#MutualFundSahiHai, #KuveraSabseSahiHai!

