Top news
SEBI Proposes Major Reforms to Reduce Mutual Fund Costs and Enhance Transparency
The Lenskart Solutions IPO, open from October 31 to November 4, 2025, was subscribed 1.13 times, led by retail investors at 1.32x and QIBs at 1.42x. The Studds Accessories IPO, open from October 30 to November 3, 2025, saw strong demand, subscribed 5.08 times, with retail investors at 6.03x and NIIs at 9.62x.
LIC AMC, Axis AMC, Groww AMC and Quant AMC Launches NFO for LIC MF Consumption Growth Direct Plan, Axis Income Plus Arbitrage Passive FoF Growth Direct Plan, Groww Nifty Midcap 150 Index Growth Direct Plan & Qsif Equity Ex Top 100 Long Short Growth Direct Plan.
Index Returns
| Index | 1W | 1Y | 3Y | P/E | P/B |
|---|---|---|---|---|---|
| NIFTY 50 | -0.3% | 6.3% | 13.0% | 22.6 | 3.5 |
| NIFTY NEXT 50 | 0.7% | -0.1% | 18.2% | 20.7 | 3.6 |
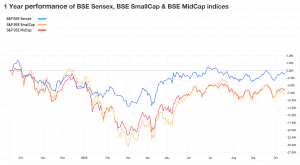
| S&P BSE SENSEX | -0.3% | 5.7% | 8.9% | 23.1 | 4.5 |
| S&P BSE SMALLCAP | 0.7% | -2.0% | 21.8% | 34.4 | 3.8 |
| S&P BSE MIDCAP | 1.0% | 2.3% | 21.7% | 33.0 | 5.0 |
| NASDAQ 100 | 2.0% | 29.1% | 12.7% | 30.5 | 4.1 |
| S&P 500 | 0.7% | 19.4 | 10.4% | 31.7 | 5.7 |

Best Performers
| Mutual Funds | 1W | 1Y | 3Y |
|---|---|---|---|
| SBI BSE PSU Bank Index Growth | 4.8% | NA | NA |
| Motilal Oswal BSE Enhanced Value Index Growth | 4.0% | 11.60% | 36.40% |
| Quant PSU Growth Direct Plan | 3.5% | -2.70% | NA |
| ICICI Prudential Nifty200 Value 30 Index Growth | 3.4% | 9.10% | NA |
| HSBC Global Emerging Markets Growth | 3.2% | 31.10% | 21.30% |
| ELSS Tax Saving Funds | 1W | 1Y | 3Y |
|---|---|---|---|
| ITI ELSS Tax Saver | 1.3% | 6.4% | 22.7% |
| Bank Of India ELSS Tax Saver | 1.0% | -2.3% | 18.2% |
| Bajaj Finserv ELSS Tax Saver | 1.2% | NA | NA |
| Baroda BNP Paribas ELSS Tax Saver | 0.8% | 5.5% | 19.7% |
| Samco ELSS Tax Saver | -0.4% | -9.0% | NA |
| Stocks (Market cap > Rs 50k Cr) | 1W | 1Y | 5Y |
|---|---|---|---|
| Bharat Heavy Electricals | 13.3% | 12.2% | 56.8% |
| Indian Oil Corporation | 10.5% | 15.7% | 25.6% |
| IDBI Bank | 10.3% | 24.0% | 23.3% |
| Adani Green Energy | 9.1% | -30.2% | 5.9% |
| Suzlon Energy | 8.8% | -13.0% | 77.7% |
Worst Performers
| Mutual Funds | 1W | 1Y | 3Y |
|---|---|---|---|
| Motilal Oswal Nifty Capital Market Index Growth | -1.8% | NA | NA |
| Tata Nifty Capital Markets Index Growth | -1.8% | 21.90% | NA |
| Parag Parikh ELSS Tax Saver Direct | -1.8% | 6.90% | 17.70% |
| Quant Bfsi Growth Direct | -1.6% | 18.10% | NA |
| NJ Flexi Cap Growth Direct | -1.5% | -4.90% | NA |
| Stocks (Market cap > Rs 50k Cr) | 1W | 1Y | 5Y |
|---|---|---|---|
| Cipla | -8.7% | 5.9% | 14.8% |
| Bajaj Holdings & Investment | -6.4% | 20.3% | 39.8% |
| Dr. Reddy's Laboratories | -6.4% | -4.2% | 4.1% |
| Jindal Stainless | -5.8% | 11.0% | 64.5% |
| Tube Investments of India | -5.7% | -32.3% | 35.8% |
What Investors Bought
| Most Bought MF | 1W | 1Y | 3Y |
|---|---|---|---|
| Parag Parikh Flexi Cap | 1.4% | 10.1% | 22.2% |
| Kotak Nifty India Tourism Index | -0.5% | 10.2% | NA |
| HDFC Flexicap | 0.1% | 10.9% | 22.9% |
| UTI Nifty 50 Index | -0.2% | 7.4% | 13.6% |
| Nippon India Large Cap | -0.1% | 8.4% | 20.3% |
What Investors Sold
| Most sold MF | 1W | 1Y | 3Y |
|---|---|---|---|
| SBI Gold | -0.3% | 49.7% | 32.4% |
| Kotak Arbitrage | 0.0% | 7.1% | 7.8% |
| Quant Multi Cap | 0.6% | -4.0% | 13.3% |
| Quant Mid Cap | 1.1% | -4.9% | 18.6% |
| 360 One Focused | -0.5% | 2.9% | 16.9% |
Most Watchlisted
| A | B | C | D |
|---|---|---|---|
Mutual Fund Watchlist | 1W | 1Y | 3Y |
| Axis Nifty 50 Index | -0.2% | 7.5% | 14.4% |
| Axis Small Cap | 0.8% | 5.6% | 20.8% |
| UTI Nifty Next 50 Index | 0.7% | 0.5% | 18.9% |
| Parag Parikh Flexi Cap | 1.4% | 10.1% | 22.2% |
| HDFC Flexicap | 0.1% | 10.9% | 22.9% |
Stocks Watchlist | 1W | 1Y | 5Y |
|---|---|---|---|
| Nippon India ETF Gold BeES | -0.7% | 49.2% | NA |
| Nippon India Silver ETF | 2.5% | 48.9% | NA |
| Mirae Asset NYSE FANG+ETF | 5.4% | 80.5% | NA |
| Tata Gold ETF | -0.5% | 49.3% | NA |
| Bharat Electronics | 1.8% | 47.7% | 71.2% |
US Stocks Watchlist | 1W | 1Y | 5Y |
|---|---|---|---|
| Rigetti Computing | 14.0% | 3499.2% | NA |
| Porch Group | -8.1% | 581.0% | 8.4% |
| Rocket Lab USA | -2.6% | 451.5% | NA |
| Palantir Technologies | 8.6% | 378.2% | 81.5% |
| NVIDIA | 8.7% | 49.6% | 74.3% |
Data Source: NSE, BSE & Kuvera.in
Step-by-Step Guide: Strategies and Expert Tips for Effective Asset Allocation and Portfolio Diversification — Watch the Complete Video Below.
Read more: How to Build and Diversify a Multi-Asset Portfolio in India?
Watch/hear on YouTube:
Start investing through a platform that brings goal planning and investing to your fingertips. Visit kuvera.in to discover Direct Plans and Fixed Deposits and start investing today.
Disclaimer: Mutual Fund investments are subject to market risks. Read all scheme related documents carefully.
Registration granted by SEBI, membership of IAASB (in case of IAs) and certification from NISM in no way guarantee performance of the intermediary or provide any assurance of returns to investors.
Investment in the securities is subject to market risks. Read all the related documents carefully before investing.
The securities quoted are for illustration only and are not recommendatory.
This market update was initially published by Livemint.
#MutualFundSahiHai, #KuveraSabseSahiHai!