Top news
SEBI has overhauled the mutual fund expense framework by lowering the caps on the base expense ratio and separating out statutory levies to improve transparency and reduce costs for investors. These changes are expected to make mutual fund investing cheaper and clearer for investors.
The IPO of ICICI Prudential AMC Ltd. has closed with a strong response, garnering an overall subscription of 39.17 times. Similarly, KSH International’s IPO witnessed healthy demand, achieving 0.87 times subscription on the final day. Meanwhile, a new IPO from Gujarat Kidney & Super Speciality is set to open for investors with the price band set at ₹108.00 to ₹114.00 per share .
DSP AMC have launched NFO for Tata BSE Multicap Consumption 50:30:20 Index Growth Direct Plan
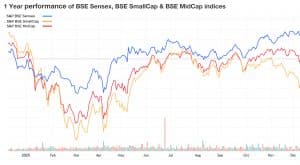
Index Returns
| Index | 1W | 1Y | 3Y | P/E | P/B |
|---|---|---|---|---|---|
| NIFTY 50 | -0.3% | 8.4% | 12.4% | 22.6 | 3.5 |
| NIFTY NEXT 50 | -0.2% | -3.2% | 16.7% | 19.9 | 3.6 |
| S&P BSE SENSEX | -0.4% | 7.2% | 8.9% | 23.2 | 4.5 |
| S&P BSE SMALLCAP | -0.2% | -9.8% | 21.8% | 32.0 | 3.5 |
| S&P BSE MIDCAP | 0.2% | -1.8% | 21.7% | 32.0 | 4.9 |
| NASDAQ 100 | 0.6% | 19.1% | 12.7% | 34.0 | 4.5 |
| S&P 500 | 0.1% | 15.2% | 10.4% | 30.8 | 5.5 |

Best Performers
| Mutual Funds | 1W | 1Y | 3Y |
|---|---|---|---|
| UTI Silver ETF FoF | 4.8% | 1.2% | NA |
| ABSL Silver ETF FoF | 4.7% | 1.2% | 0.4% |
| DSP Silver ETF FoF | 4.7% | NA | NA |
| ICICI Pru Silver ETF FoF | 4.7% | 1.2% | 0.4% |
| SBI Silver ETF FoF | 4.6% | 1.0% | NA |
| ELSS Tax Saving Funds | 1W | 1Y | 3Y |
|---|---|---|---|
| Bajaj Finserv ELSS Tax Saver | 0.4% | NA | NA |
| Bank Of India ELSS Tax Saver | 0.4% | -6.9% | 16.8% |
| Motilal Oswal ELSS Tax Saver | 0.4% | -12.2% | 22.3% |
| ITI ELSS Tax Saver | 0.3% | 1.5% | 20.7% |
| Samco ELSS Tax Saver | 0.2% | -14.5% | NA |
| Stocks (Market cap < Rs 50k Cr) | 1W | 1Y | 5Y |
|---|---|---|---|
| Hindustan Zinc | 12.7% | 21.3% | 19.5% |
| Mahindra & Mahindra Financial Services | 10.7% | 43.7% | 17.0% |
| Vedanta | 9.9% | 17.1% | 31.6% |
| Ashok Leyland | 8.3% | 55.8% | 28.7% |
| Interglobe Aviation | 6.9% | 17.4% | 25.6% |
Worst Performers
| Mutual Funds | 1W | 1Y | 3Y |
|---|---|---|---|
| Invesco India Invesco Global Consumer Trends FoF | -4.8% | 20.8% | 25.9% |
| Edelweiss Greater China Equity Off Shore Growth | -3.1% | 36.1% | 12.3% |
| Edelweiss Emerging Markets Opportunities Equity Off Shore Growth | -2.9% | 35.8% | 16.2% |
| Edelweiss US Technology Equity FoF Growth | -2.8% | 17.1% | 36.5% |
| Axis Global Innovation FoF Growth | -2.8% | 15.4% | 23.3% |
| Stocks (Market cap > Rs 50k Cr) | 1W | 1Y | 5Y |
|---|---|---|---|
| Indian Overseas Bank | -8.1% | -36.9% | 25.4% |
| Siemens Energy India | -5.5% | NA | NA |
| Solar Industries India | -4.4% | 15.4% | 62.2% |
| -4.2% | 32.6% | 34.5% | |
| Hitachi Energy India | -3.5% | 44.5% | 69.8% |
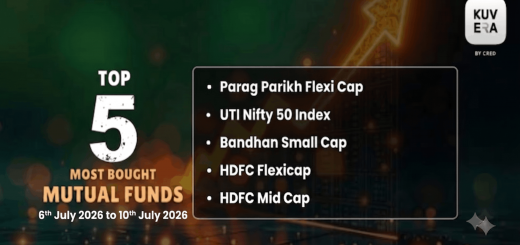
What Investors Bought
| Most Bought MF | 1W | 1Y | 3Y |
|---|---|---|---|
| Parag Parikh Flexi Cap | -0.6% | 6.8% | 22.1% |
| HDFC Flexicap | -0.7% | 10.2% | 21.5% |
| SBI Gold | 0.1% | 71.9% | 33.2% |
| UTI Nifty 50 Index | -0.3% | 7.8% | 13.3% |
| Bandhan Small Cap | -0.3% | -3.9% | 30.3% |
What Investors Sold
| Most sold MF | 1W | 1Y | 3Y |
|---|---|---|---|
| Quant Multi Cap | -0.4% | -6.4% | 10.2% |
| Whiteoak Capital Equity Saving | 0.0% | NA | NA |
| Kotak Large & Midcap | -0.1% | 3.0% | 19.6% |
| JM Flexicap | -0.2% | -7.7% | 21.1% |
| Kotak Small Cap | -1.0% | -11.4% | 15.6% |
Most Watchlisted
Mutual Fund Watchlist | 1W | 1Y | 3Y |
|---|---|---|---|
| Axis Nifty 50 Index Growth Direct | -0.3% | 7.9% | 13.3% |
| Axis Small Cap Growth Direct | -0.4% | -4.1% | 18.2% |
| UTI Nifty Next 50 Index Growth Direct | -0.2% | -4.1% | 16.9% |
| Parag Parikh Flexi Cap Growth Direct | -0.6% | 6.8% | 22.1% |
| HDFC Flexicap Growth Direct | -0.7% | 10.2% | 21.5% |
Stocks Watchlist | 1W | 1Y | 5Y |
|---|---|---|---|
| Nippon India ETF Gold BeES | -0.6% | 70.6% | NA |
| Motilal Oswal NASDAQ 100 ETF | 0.8% | 11.1% | NA |
| Mirae Asset NYSE FANG+ETF | -6.2% | 18.8% | NA |
| Nippon India Silver ETF | 6.1% | 122.0% | NA |
| Tata Silver ETF | 5.9% | 122.5% | NA |
US Stocks Watchlist | 1W | 1Y | 5Y |
|---|---|---|---|
| Rigetti Computing | -8.1% | 153.6% | NA |
| Rocket Lab USA | 14.7% | 183.6% | 46.8% |
| Advanced Micro Devices | 1.3% | 79.0% | 17.3% |
| Alphabet | -0.7% | 60.5% | 28.9% |
| NVIDIA Corporation | 3.4% | 34.4% | 68.5% |
Data Source: NSE, BSE & Kuvera.in
Strategies for Equity Portfolio Diversification
Read more: ETFs or Index Funds: A quick comparison
Watch/hear on YouTube:
Start investing through a platform that brings goal planning and investing to your fingertips. Visit kuvera.in to discover Direct Plans and Fixed Deposits and start investing today.
Disclaimer: Mutual Fund investments are subject to market risks. Read all scheme related documents carefully.
Registration granted by SEBI, membership of IAASB (in case of IAs) and certification from NISM in no way guarantee performance of the intermediary or provide any assurance of returns to investors.
Investment in the securities is subject to market risks. Read all the related documents carefully before investing.
The securities quoted are for illustration only and are not recommendatory.
This market update was initially published by Livemint.
#MutualFundSahiHai, #KuveraSabseSahiHai!