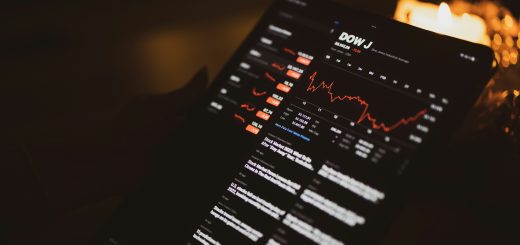
A US stock quote gives a look at a stock’s current price and how it’s trading. It includes the traded price, the best bid and best ask the high and low for the day the number of shares traded and some key numbers that show the size and value of the company. For an investor reading a quote correctly helps understand how much a stock costs right now how much trading is happening and where the price stands in relation to recent months.
To read a US stock quote well an investor from India must know which numbers change every seconds and which ones stay the same. It’s also important to remember that all prices are in US dollars. The quote may reflect trading hours or extended hours. The tables below explain each part of the quote and what to check before placing an order.
The main fields in a quote
| Field | What it shows | How to use it |
|---|---|---|
| Ticker | The short name for the stock like a letters | Make sure you have the right company and exchange before you order. |
| Price | The price of the most recent trade | This may lie between the bid and the ask. |
| Change and percentage change | How much the price has moved since the close | The percentage change helps compare across stocks. |
| Ask | The best price a buyer is willing to pay and the best price a seller wants | A market buy pays the ask and a market sell receives the bid. |
| Bid. Ask size | The number of shares buyers want at the bid and sellers want at the ask | Small sizes mean a big order may not fill at the price. |
| Open, high and low | The price of the day and the highest and lowest so far | These show how far the price has moved during the session. |
| Previous close | The price at the end of the trading day | This is the base for calculating the change. |
| Volume | The number of shares traded today | Compare it to the volume to see if trading is unusually high or low. |
| Average volume | The average number of shares traded over a period | High average volume means easier trading. |
Fields about the company and its valuation
| Field | What it shows | A caution |
|---|---|---|
| Market capitalization | Share price times the number of shares | It shows size not whether the stock is overpriced or underpriced. |
| Price-to-earnings ratio (P/E) | Price divided by earnings per share | This number doesn’t make sense if earnings are negative. |
| Earnings per share (EPS) | Net profit divided by the number of shares | Check if this is the trailing EPS or the forward estimate. |
| Dividend yield | Yearly dividend divided by the stock price | A very high yield can be a warning sign about future payouts. |
| 52-Week. Low | The lowest prices in the past year | They show where the stock sits in its yearly range. |
| Beta | How much the stock moves compared with the market | A beta above 1 means the stock swings more than the market. |
A worked example
Here’s a real-life example: a stock shows a price of $50.20, a bid of $50.18 an ask of $50.22, a previous close of $49.00 a day’s range of $49.50 to $50.60 and a volume of 3 million shares against an average volume of 2 million.
| Reading | Conclusion |
|---|---|
| Change from the close | $1.20 or about 2.4%—so the stock is up on the day. |
| Bid-ask spread | $0.04 or 0.08% of the price—so trading is cheap. |
| Position in the days range | The price is near the half of the $49.50 to $50.60 range. |
| Volume compared with the | 1.5 times the average—so there’s above-normal interest. |
Regular hours and extended hours
| Session | Features of the quote |
|---|---|
| Regular hours (9:30 AM to 4:00 PM Eastern Time) | The active trading, with the narrowest spreads. |
| Pre-market and after-hours | Fewer people, wider spreads and bigger price jumps—the last price may differ from the close. |
Regular hours in the US run from 7:00 PM to 1:30 AM time during daylight saving time. During time these hours are from 8:00 PM to 2:30 AM Indian time.
Common mistakes when reading a quote
| Mistake | Why it misleads |
|---|---|
| Treating the price as the price to be paid | A market buy pays the ask, which may be higher than the last price. |
| Ignoring volume | A price move on volume may not last. |
| Confusing market capitalization with value | Market cap shows size, not whether the stock is fairly priced. |
| Reading a delayed quote as live | Free sources often show quotes delayed by minutes. |
| Forgetting the exchange rate | A dollar price turns into a rupee amount each day. |
What investors should take from this
A stock quote shows not the price but also the cost of buying and the level of activity. Before placing an order check the bid, the ask, the volume and the session. Use a limit order when the spread is wide. This makes a look into a better decision.
Kuvera’s guides on the bid-ask spread and on how to read a US stock market chart go into detail on two parts of the quote.
Frequently Asked Questions
1. What does a US stock quote show?
It shows the price, the bid and ask the day’s range the volume and measures like market capitalization the P/E ratio and the dividend yield.
2. What is the difference between the bid and the ask?
The bid is the price a buyer will pay. The ask is the price a seller will accept. A market buy pays the ask.
3. What does volume tell investors?
Volume tells how many shares have traded. High volume suggests interest. Low volume means trading is thin.
4. Why does the last price differ from the ask?
The last price is the recent trade. The ask is the current offer. They can differ by the spread or more.
5. Are free quotes time?
Not always. Some free sources show quotes that are delayed. Use the quote on your trading platform for better accuracy.
Investments in securities are subject to market risks. Read all documents carefully. The figures, in the example are illustrations and not market quotes.