Top news
As per GDP data released by the National Statistics Office, the Indian economy grew by 1.6% in the March quarter and contracted by 7.3% for the full financial year 2020-21.
RBI’s MPC kept the repo rate & reverse repo rate unchanged at 4% and 3.35% respectively with an accommodative stance. RBI revised its estimate of real GDP growth to be at 9.5% in FY22 while inflation estimated to remain at 5.1%.
Franklin Mutual Fund has announced the payout of the next tranche of Rs 2642 crore to unitholders of the six wound-up schemes. Unitholders can check their payout status here.
Index Returns
| Index | 1W | 1Y | 3Y | P/E | P/B |
|---|---|---|---|---|---|
| NIFTY 50 | 1.5% | 56.1% | 13.8% | 29.1 | 4.4 |
| NIFTY NEXT 50 | 4.1% | 56.4% | 10.7% | 32.2 | 5.3 |
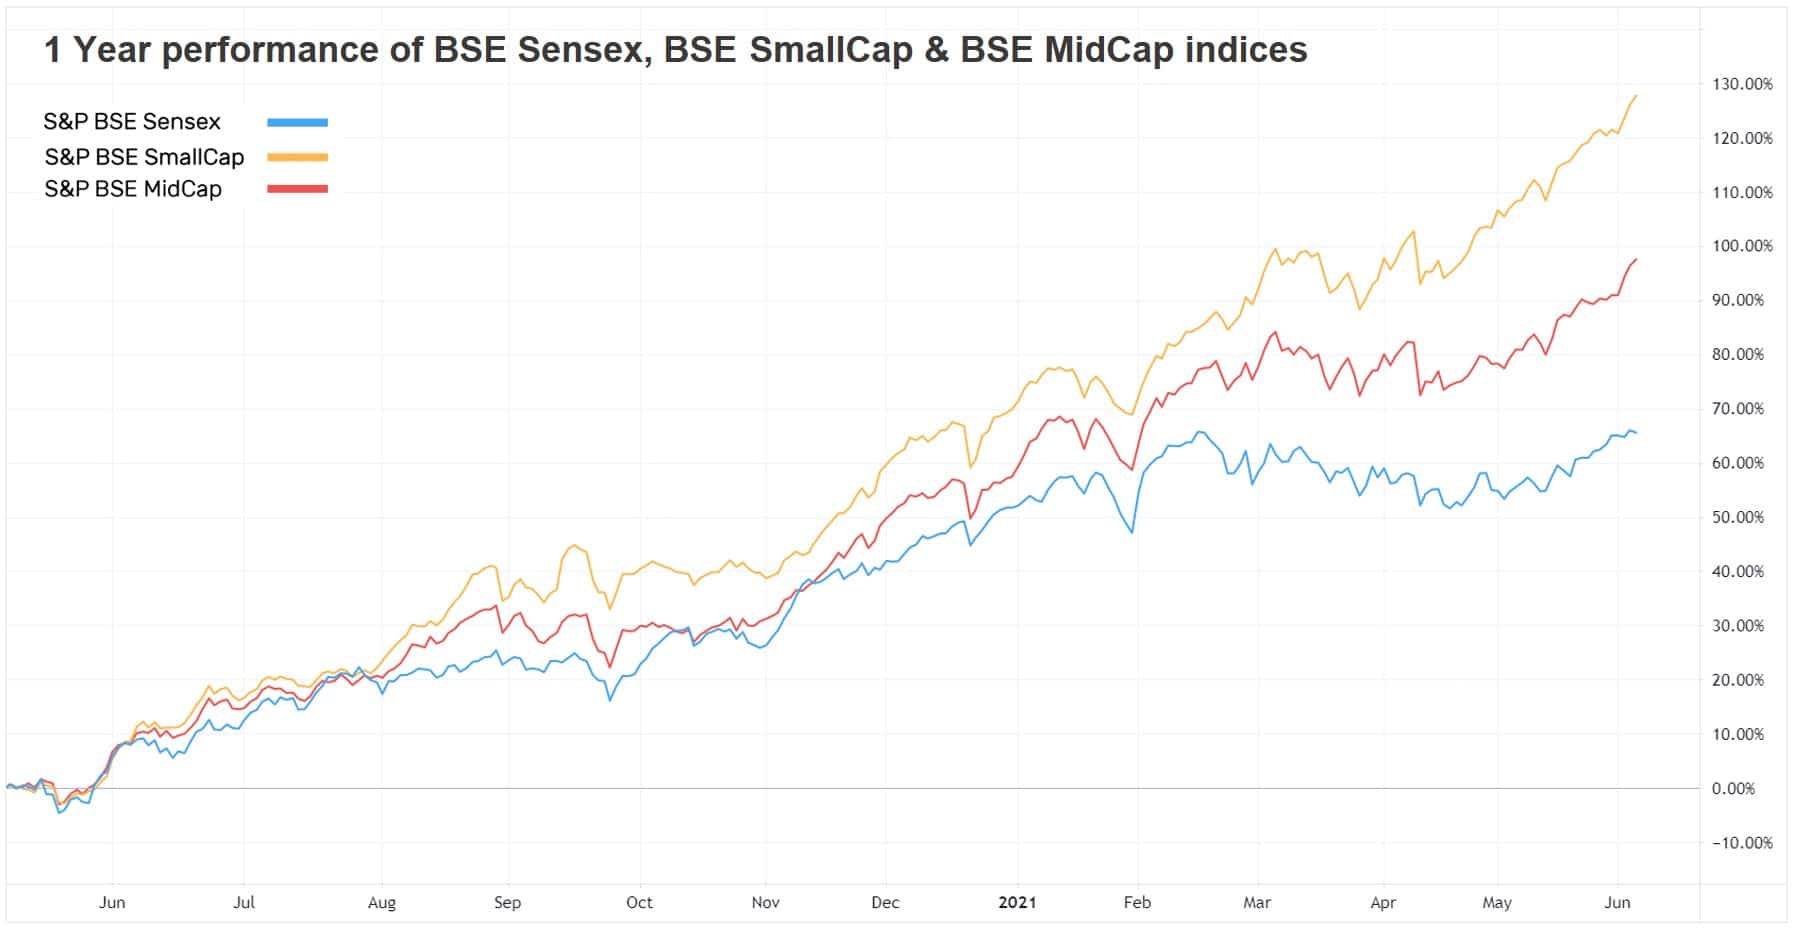
| S&P BSE SENSEX | 1.3% | 53.2% | 14.2% | 31.5 | 3.3 |
| S&P BSE SmallCap | 3.3% | 109.5% | 13.5% | 46.0 | 2.4 |
| S&P BSE MidCap | 3.9% | 82.3% | 12.7% | 48.9 | 3.2 |
| NASDAQ 100 | 0.6% | 42.9% | 24.4% | 36.2 | 8.4 |
| S&P 500 | 0.6% | 35.8% | 15.5% | 29.9 | 4.6 |

Best Performers
| Mutual Funds | 1W | 1Y | 3Y |
|---|---|---|---|
| HSBC Brazil | 8.7% | 29.2% | 5.9% |
| IDFC Infrastructure | 4.7% | 97.6% | 8.9% |
| UTI Nifty Next 50 Index | 4.1% | 56.7% | NA |
| IPRU Nifty Next 50 Index | 4.1% | 56.4% | 11.0% |
| 4.0% | 55.2% | 11.1% |
| ELSS Tax Saving Funds | 1W | 1Y | 3Y |
|---|---|---|---|
| Motilal Oswal Long Term Equity | 3.5% | 62.4% | 11.8% |
| Franklin India Taxshield | 2.7% | 71.2% | 12.3% |
| Indiabulls Tax Saving | 2.6% | 50.8% | 10.6% |
| Axis Long Term Equity | 2.5% | 54.7% | 16.10% |
| 2.4% | 59.3% | 11.2% |
| Stocks (Top 200 by market cap) | 1W | 1Y | 5Y |
|---|---|---|---|
| Adani Enterprises | 28.4% | 1030.4% | 89.4% |
| Adani Gas | 22.1% | 1102.7% | NA |
| Muthoot Finance | 21.1% | 63.1% | 44.0% |
| Oil & Natural Gas Corp | 12.2% | 45.6% | 1.7% |
| 11.0% | 145.7% | 32.7% |
Worst Performers
| Mutual Funds | 1W | 1Y | 3Y |
|---|---|---|---|
| DSP World Gold | -1.1% | 11.7% | 21.4% |
| -0.6% | 11.5% | 4.1% | |
| Nippon India Nivesh Lakshya | -0.4% | 3.7% | NA |
| -0.4% | 10.0% | 4.5% | |
| -0.4% | 7.8% | 11.1% |
| Stocks (Top 200 by market cap) | 1W | 1Y | 5Y |
|---|---|---|---|
| Tata Steel | -15.3% | 333.2% | NA |
| Aurobindo Pharma | -7.1% | 27.8% | 4.3% |
| Gland Pharma | -4.5% | NA | NA |
| Sun Pharmaceuticals Industries | -3.7% | 41.6% | -1.3% |
| -2.9% | 65.9% | 4.3% |
Bought and Sold
| Bought on kuvera.in | 1W | 1Y | 3Y |
|---|---|---|---|
| Parag Parikh Flexi Cap | -0.2% | 61.6% | 21.6% |
| UTI Nifty Index | 1.7% | 57.7% | 14.9% |
| Axis Bluechip | 2.0% | 48.6% | 17.5% |
| Axis Mid Cap | 2.4% | 62.5% | 21.1% |
| 0.5% | 29.3% | NA |
| Sold on kuvera.in | 1W | 1Y | 3Y |
|---|---|---|---|
| Motilal Oswal Flexi Cap | 1.5% | 50.0% | 8.9% |
| IPRU Bluechip | 1.6% | 54.5% | 13.8% |
| IPRU Sensex Index | 1.5% | 54.2% | 15.1% |
| HDFC Top 100 | 2.0% | 59.8% | 13.1% |
| 2.0% | 71.3% | 14.6% |
Most Watchlisted
Mutual Fund Watchlist | 1W | 1Y | 3Y |
|---|---|---|---|
| Quant Small Cap | 2.0% | 198.5% | 29.4% |
| Parag Parikh Flexi Cap | -0.2% | 61.6% | 21.6% |
| Mirae Asset Emerging Bluechip | 1.6% | 76.4% | 22.2% |
| ICICI Prudential Technology | 0.4% | 122.1% | 31.2% |
| 0.1% | 103.0% | 28.7% |
Stocks Watchlist | 1W | 1Y | 5Y |
|---|---|---|---|
| Reliance Industries | 10.7% | 42.0% | 36.1% |
| Adani Green Energy | 1.1% | 367.6% | NA |
| Infosys | -1.4% | 97.5% | 18.7% |
| Tata Consultancy Services | -1.2% | 53.7% | 20.5% |
| 5.1% | 239.0% | -5.9% |
US Stocks Watchlist | 1W | 1Y | 5Y |
|---|---|---|---|
| Tesla | -4.2% | 238.4% | 68.7% |
| Apple | 1.0% | 51.9% | 38.8% |
| Amazon.com | -0.5% | 29.1% | 34.6% |
| Microsoft Corporation | 0.4% | 33.9% | 37.1% |
| 0.5% | 43.1% | 22.8% |
Data Source: NSE, BSE & Kuvera.in
Interested in how we think about the markets?
Read more: Zen And The Art Of Investing
Watch/hear on YouTube:
Start investing through a platform that brings goal planning and investing to your fingertips. Visit kuvera.in to discover Direct Plans and start investing today.
#MutualFundSahiHai, #KuveraSabseSahiHai!