Top news
Data released by the industry department shows that the output of the eight core sector industries rose by 6.8 percent in March, as compared to a year ago.
SEBI has released a circular stating that 20% of the compensation of key personnel in asset management companies (AMC) should be in the form of units of the mutual fund schemes they manage. Such units will be under lock-in for 3 years.
SBI Mutual Fund has launched the NFO for SBI Nifty Next 50 Fund. The NFO closes on May 11.
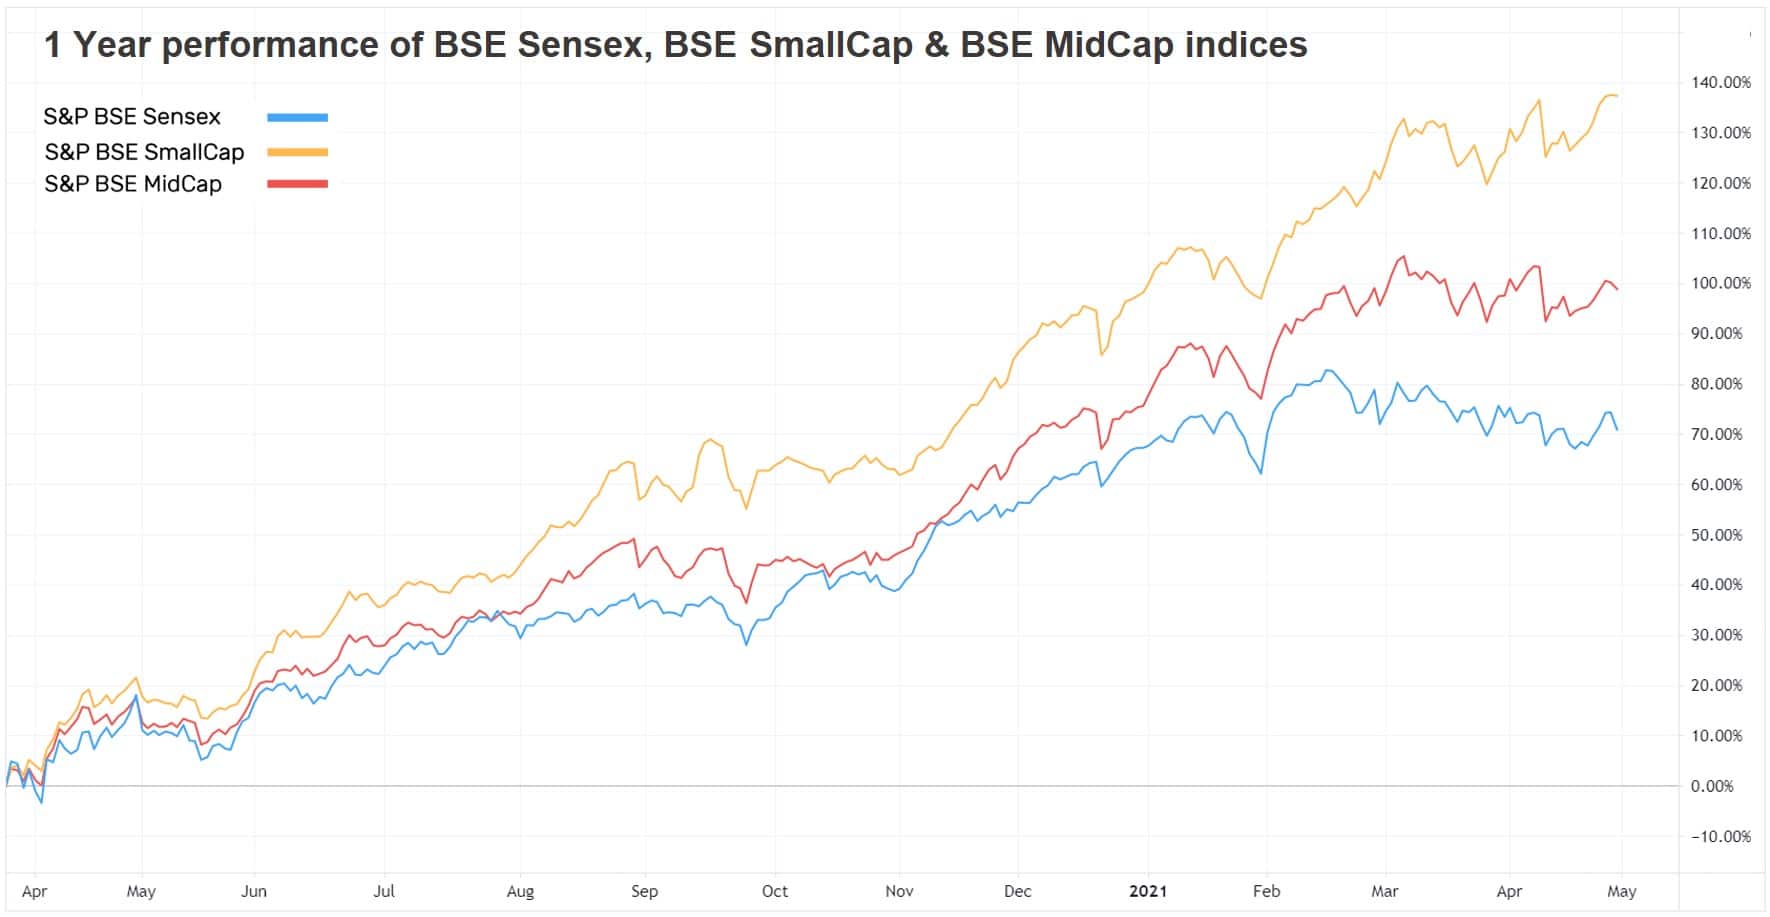
Index Returns
| Index | 1W | 1Y | 3Y | P/E | P/B |
|---|---|---|---|---|---|
| NIFTY 50 | 2.0% | 48.3% | 10.9% | 32.2 | 4.2 |
| NIFTY NEXT 50 | 1.4% | 44.1% | 4.3% | 42.7 | 4.6 |
| S&P BSE SENSEX | 1.9% | 44.6% | 11.5% | 32.1 | 3.3 |
| S&P BSE SmallCap | 3.2% | 94.9% | 5.6% | 75.0 | 3.0 |
| S&P BSE MidCap | 1.8% | 68.9% | 6.1% | 58.0 | 3.0 |
| NASDAQ 100 | -0.6% | 53.9% | 28.0% | 37.3 | 8.6 |
| S&P 500 | 0.0% | 43.4% | 16.4% | 30.7 | 4.5 |

Best Performers
| Mutual Funds | 1W | 1Y | 3Y |
|---|---|---|---|
| SBI Magnum Comma | 6.0% | 83.1% | 15.1% |
| Tata Resources & Energy | 5.6% | 79.9% | 18.9% |
| SBI PSU | 5.4% | 36.2% | -0.4% |
| 5.2% | 105.7% | 12.4% | |
| 4.8% | 31.8% | 8.0% |
| ELSS Tax Saving Funds | 1W | 1Y | 3Y |
|---|---|---|---|
| BOI AXA Tax Advantage | 3.5% | 62.7% | 13.0% |
| Quant Tax | 3.4% | 117.0% | 24.4% |
| Baroda Elss 96 B | 3.3% | 55.4% | 6.80% |
| IDFC Tax Advantage | 3.3% | 79.3% | 10.10% |
| 3.1% | 60.1% | 8.7% |
| Stocks (Top 200 by market cap) | 1W | 1Y | 5Y |
|---|---|---|---|
| Steel Authority Of India | 27.1% | 295.5% | 20.6% |
| Bajaj Finance | 16.2% | 137.7% | 51.6% |
| Vedanta | 13.6% | 225.1% | 26.10% |
| Tata Steel | 12.2% | 266.0% | 26.60% |
| 12.0% | 337.1% | 39.7% |
Worst Performers
| Mutual Funds | 1W | 1Y | 3Y |
|---|---|---|---|
| DSP World Gold | -6.0% | 4.6% | 17.8% |
| Nippon India Gold Saving | -2.2% | -4.7% | 13.5% |
| Invesco India Gold | -2.2% | -3.2% | 13.9% |
| SBI Gold | -2.1% | -3.3% | 13.6% |
| -2.1% | -3.4% | 13.2% |
Stocks (Top 200 by market cap) | 1W | 1Y | 5Y |
|---|---|---|---|
| AU Small Finance Bank | -8.2% | 86.6% | NA |
| Britannia Industries | -8.1% | 9.3% | 20.8% |
| HCL Technologies | -6.4% | 83.0% | 20.5% |
| Mahindra & Mahindra | -5.9% | 116.3% | 3.3% |
| -5.0% | 7.9% | 31.3% |
Bought and Sold
| Bought on kuvera.in | 1W | 1Y | 3Y |
|---|---|---|---|
| Parag Parikh Flexi Cap | 2.7% | 68.2% | 20.3% |
| Quant Small Cap | 5.1% | 175.0% | 24.3% |
| Axis Mid Cap | 2.0% | 54.8% | 17.0% |
| Axis Bluechip | 2.6% | 39.1% | 15.2% |
| 2.4% | 54.1% | 9.2% |
| Sold on kuvera.in | 1W | 1Y | 3Y |
|---|---|---|---|
| IPRU Sensex Index | 1.9% | 45.4% | 12.5% |
| IPRU Value Discovery | 2.7% | 61.7% | 11.3% |
| L&T Emerging Businesses | 4.0% | 93.3% | 5.00% |
| HDFC Index Nifty 50 | 2.0% | 49.5% | 11.8% |
| 0.6% | 42.3% | 4.9% |
Most Watchlisted
Mutual Fund Watchlist | 1W | 1Y | 3Y |
|---|---|---|---|
| Tata Digital India | 1.0% | 98.2% | 24.9% |
| Parag Parikh Flexi Cap | 2.7% | 68.2% | 20.3% |
| IPRU Technology | 1.3% | 116.1% | 27.10% |
| Mirae Asset Emerging Bluechip | 3.0% | 65.0% | 17.3% |
| 2.0% | 68.8% | 33.2% |
Stocks Watchlist | 1W | 1Y | 5Y |
|---|---|---|---|
| Reliance Industries | 4.6% | 41.2% | 32.9% |
| Adani Green Energy | -0.5% | 393.0% | NA |
| Infosys | 0.2% | 99.8% | 19.00% |
| Tata Consultancy Services | -2.6% | 59.5% | 20.6% |
| -0.7% | 44.6% | 20.5% |
US Stocks Watchlist | 1W | 1Y | 5Y |
|---|---|---|---|
| Tesla | -2.7% | 405.5% | 71.3% |
| Apple | -2.1% | 81.8% | 41.2% |
| Amazon.com | 3.8% | 51.6% | 39.4% |
| Microsoft Corporation | -3.4% | 44.5% | 38.3% |
| 8.0% | 60.7% | 22.6% |
Data Source: NSE, BSE & Kuvera.in
Interested in how we think about the markets?
Read more: Zen And The Art Of Investing
Watch/hear on YouTube:
Start investing through a platform that brings goal planning and investing to your fingertips. Visit kuvera.in to discover Direct Plans and start investing today.
#MutualFundSahiHai, #KuveraSabseSahiHai!