Top news
The Securities and Exchange Board of India (SEBI) has announced that it is been revised that its 2022 framework for addressing technical glitches in stock brokers' trading systems by streamlining eligibility to exclude smaller brokers, exempting minor/global issues, extending reporting timelines to 2 hours via a single platform, rationalizing capacity/testing/DR requirements by broker size, and adjusting disincentives—effective January 9, 2026, superseding prior guidelines.
India’s mutual fund industry added ₹14 lakh crore in 2025, taking AUM to a record ₹81 lakh crore by November, driven by strong retail participation and record SIP inflows of over ₹3 lakh crore. Equity markets, rising investor base, and regulatory reforms supported sustained, long-term growth.
Jioblackrock AMC has launched NFO for Jioblackrock Short Duration Growth Direct Plan and Jioblackrock Low Duration Growth Direct Plan , Grow AMC has launched NFO for Groww Small Cap Growth Direct Plan , Mahindra AMC has launched NFO for Mahindra Manulife Innovation Opportunities Growth Direct Plan and Wealth AMC has launched NFO for The Wealth Company Gold ETF FoF Growth Direct Plan .
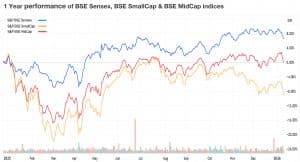
Index Returns
| Index | 1W | 1Y | 3Y | P/E | P/B |
|---|---|---|---|---|---|
| NIFTY 50 | -2.5% | 9.2% | 13.1% | 22.4 | 3.5 |
| NIFTY NEXT 50 | -2.7% | 4.5% | 18.2% | 19.9 | 3.6 |
| S&P BSE SENSEX | -2.5% | 7.6% | 8.9% | 23.1 | 4.5 |
| S&P BSE SMALLCAP | -3.9% | -7.6% | 21.8% | 31.5 | 3.5 |
| S&P BSE MIDCAP | -2.6% | 2.4% | 21.7% | 32.1 | 4.9 |
| NASDAQ 100 | 2.2% | 23.6% | 12.7% | 35.0 | 4.7 |
| S&P 500 | 1.6% | 19.6% | 10.4% | 31.5 | 5.7 |

Best Performers
| Mutual Funds | 1W | 1Y | 3Y |
|---|---|---|---|
| ABSL Silver ETF FoF | 3.8% | 162.0% | 48.9% |
| Nippon India Silver ETF FoF | 3.8% | 162.4% | 49.0% |
| ICICI Pru Silver ETF FoF | 3.8% | 161.5% | 49.1% |
| Kotak Silver ETF FoF | 3.8% | 162.9% | NA |
| Zerodha Silver ETF FoF | 3.7% | NA | NA |
| ELSS Tax Saving Funds | 1W | 1Y | 3Y |
|---|---|---|---|
| NJ ELSS Tax Saver | -1.4% | NA | NA |
| HDFC ELSS Tax Saver | -1.7% | 11.2% | 22.2% |
| DSP ELSS Tax Saver | -2.0% | 9.0% | 21.2% |
| Aditya Birla Sun Life ELSS Tax Saver | -2.1% | 10.4% | 16.2% |
| HSBC Tax Saver Equity | -2.1% | 2.1% | 17.4% |
| Stocks (Market cap < Rs 50k Cr) | 1W | 1Y | 5Y |
|---|---|---|---|
| Solar Industries India | 8.4% | 37.1% | 64.1% |
| Yes Bank | 6.3% | 21.7% | 5.5% |
| Alkem Laboratories | 6.1% | 4.3% | 14.8% |
| Union Bank Of India | 5.7% | 46.0% | 40.6% |
| Bharat Electronics | 5.3% | 48.4% | 57.4% |
Worst Performers
| Mutual Funds | 1W | 1Y | 3Y |
|---|---|---|---|
| Groww Nifty India Railways PSU Index | -6.0% | NA | NA |
| Tata Nifty India Tourism Index | -5.9% | -8.3% | NA |
| Kotak Nifty India Tourism Index | -5.9% | -8.3% | NA |
| Quant Commodities | -5.6% | -4.2% | NA |
| Quant PSU | -5.56 | -0.7% | NA |
| Stocks (Market cap > Rs 50k Cr) | 1W | 1Y | 5Y |
|---|---|---|---|
| Waaree Energies Ltd | -13.9% | -5.7% | NA |
| Hindustan Petroleum Corporation | -10.0% | 14.7% | 29.3% |
| Swiggy Ltd | -10.0% | -28.3% | NA |
| Jindal Stainless | -9.6% | 19.6% | 58.3% |
| GE Vernova T&D India Ltd | -8.4% | 45.6% | 88.6% |
What Investors Bought
| Most Bought MF | 1W | 1Y | 3Y |
|---|---|---|---|
| Parag Parikh Flexi Cap | -0.2% | 8.4% | 23.3% |
| UTI Nifty 50 Index | -1.0% | 10.4% | 14.2% |
| HDFC Flexicap | 0.1% | 13.2% | 22.9% |
| Tata Arbitrage | 0.2% | 7.2% | 7.9% |
| SBI Gold | 1.5% | 72.4% | 33.4% |
What Investors Sold
| Most sold MF | 1W | 1Y | 3Y |
|---|---|---|---|
| Quant Multi Cap | -1.7% | -5.1% | 10.8% |
| Quant Flexi Cap | -1.8% | 3.8% | 16.9% |
| -0.6% | 20.3% | 23.1% | |
| Quant Mid Cap | -2.6% | -6.7% | 15.0% |
| 0.1% | 7.5% | 7.5% |
Most Watchlisted
Mutual Fund Watchlist | 1W | 1Y | 3Y |
|---|---|---|---|
| Motilal Oswal BSE Enhanced Value | -3.4% | 19.6% | 31.4% |
| UTI Nifty 500 Value 50 Index | -3.2% | 15.9% | NA |
| Aditya Birla Sun Life PSU Equity | -2.8% | 12.2% | 27.7% |
| ICICI Prudential PSU Equity | -3.1% | 8.7% | 28.5% |
| Kotak Bond Growth Direct | -0.2% | 6.0% | 7.8% |
Stocks Watchlist | 1W | 1Y | 5Y |
|---|---|---|---|
| Nippon India ETF Gold BeES | 1.9% | 72.7% | NA |
| Tata Silver ETF | 2.7% | 160.8% | NA |
| Hindustan Copper | -1.6% | 117.2% | 52.8% |
| Motilal Oswal NASDAQ 100 ETF | 0.9% | 25.9% | NA |
| Nippon India Silver ETF | 2.6% | 156.8% | NA |
US Stocks Watchlist | 1W | 1Y | 5Y |
|---|---|---|---|
| Palantir Technologies | 5.7% | 163.9% | 47.7% |
| Rigetti Computing | 4.8% | 176.8% | NA |
| Alphabet | 3.8% | 72.0% | 29.6% |
| Advanced Micro Devices | -8.1% | 73.2% | 16.5% |
| NVIDIA | -1.7% | 38.8% | 69.2% |
Data Source: NSE, BSE & Kuvera.in
Strategies for investing in international market.
Watch/hear on YouTube:
Start investing through a platform that brings goal planning and investing to your fingertips. Visit kuvera.in to discover Direct Plans and Fixed Deposits and start investing today.
Disclaimer: Mutual Fund investments are subject to market risks. Read all scheme related documents carefully.
Registration granted by SEBI, membership of IAASB (in case of IAs) and certification from NISM in no way guarantee performance of the intermediary or provide any assurance of returns to investors.
Investment in the securities is subject to market risks. Read all the related documents carefully before investing.
The securities quoted are for illustration only and are not recommendatory.
This market update was initially published by Livemint.
#MutualFundSahiHai, #KuveraSabseSahiHai!