Top news
Foreign investors have poured a record $12 billion into Indian equities in November, driving the Nifty 50 up over 11% as India emerges as an attractive investment destination amid global uncertainty surrounding AI-driven markets.
IPO Update: The Crystal Crop Protection IPO witnessed strong investor demand with 17.52 times subscription, while the Mahanadi Coalfields IPO recorded 0.49 times subscription as of November 20, 2026.
NFO Update: This week’s newly launched NFO schemes include Nippon India Crisil IBX SDL June 2037 Index Fund, H SIF Hybrid Long Short Fund, SBI BSE India Defence ETF FoF, Kotak Nifty Pharma Index Fund, Invesco India Nifty Metal Index Fund, Infinity Equity Long Short Fund, and Bajaj Finserv Business Cycle Fund
Index Returns
| Index | 1W | 1Y | 3Y | P/E | P/B |
|---|---|---|---|---|---|
| NIFTY 50 | 2.6% | -1.5% | 9.3% | 21.0 | 3.2 |
| NIFTY NEXT 50 | 0.5% | 5.2% | 15.9% | 17.8 | 3.5 |
| S&P BSE SENSEX | 2.9% | -2.0% | 8.9% | 21.3 | 4.5 |
| S&P BSE SMALLCAP | -0.7% | 11.7% | 21.8% | 37.7 | 5.6 |
| S&P BSE MIDCAP | -0.6% | 4.5% | 21.7% | 38.9 | 6.3 |
| NASDAQ 100 | -10.4% | 3.3% | 12.7% | 28.2 | 4.8 |
| S&P 500 | -8.6% | 4.7% | 10.4% | 23.6 | 5.5 |
Best Performers
| Mutual Funds | 1W | 1Y | 3Y |
|---|---|---|---|
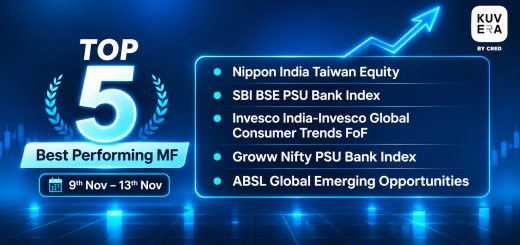
| Groww Nifty PSU Bank Index | 6.2% | NA | NA |
| SBI BSE PSU Bank Index | 6.2% | 16.2% | NA |
| Groww BSE Hospitals ETF FoF | 5.3% | NA | NA |
| SBI Nifty Bank Index | 5.0% | 9.5% | NA |
| Navi Nifty Bank Index | 5.0% | 9.3% | 14.6% |
| ELSS Tax Saving Funds | 1W | 1Y | 3Y |
|---|---|---|---|
| DSP ELSS Tax Saver | 3.3% | 3.4% | 15.8% |
| HDFC ELSS Tax Saver | 2.9% | 0.2% | 14.9% |
| Navi ELSS Tax Saver Nifty 50 Index | 2.6% | -0.7% | 10.4% |
| LIC MF ELSS Tax Saver | 2.6% | 1.4% | 11.5% |
| 360 One ELSS Tax Saver Nifty 50 Index | 2.6% | -0.7% | 10.4% |
| Stocks (Market cap < Rs 50k Cr) | 1W | 1Y | 5Y |
|---|---|---|---|
| Max Healthcare Institute | 14.2% | -7.2% | 24.8% |
| National Stock Exchange | 11.6% | NA | NA |
| Punjab National Bank | 9.6% | 24.2% | 30.1% |
| Bank Of India | 8.8% | 10.8% | 22.8% |
| Fortis Healthcare | 8.6% | -10.6% | 23.9% |
Worst Performers
| Mutual Funds | 1W | 1Y | 3Y |
|---|---|---|---|
| Nippon India Taiwan Equity | -18.4% | 22.1% | 31.1% |
| DSP World Gold Mining Overseas Equity Omni FoF | -8.8% | 4.6% | 45.2% |
| Invesco India Invesco EQQQ Nasdaq 100 ETF FoF | -7.9% | 8.2% | 24.5% |
| DSP World Mining Overseas Equity Omni FoF | -7.8% | 13.7% | 21.5% |
| Invesco India Invesco Global Consumer Trends FoF | -7.7% | -19.9% | 15.0% |
| Stocks (Market cap > Rs 50k Cr) | 1W | 1Y | 5Y |
|---|---|---|---|
| Muthoot Finance | -13.0% | -31.1% | 9.7% |
| Kalyan Jewellers India | -10.2% | 27.8% | 54.4% |
| One 97 Communications | -9.6% | 35.7% | 2.2% |
| Hindustan Zinc | -8.1% | 9.5% | 10.1% |
| Steel Authority Of India | -7.7% | 17.2% | 8.2% |
What Investors Bought
| Most Bought MF | 1W | 1Y | 3Y |
|---|---|---|---|
| Parag Parikh Flexi Cap | -0.1% | 0.4% | 12.8% |
| Invesco India Large & Mid Cap | 1.6% | 14.8% | 23.3% |
| Invesco India Arbitrage | 0.2% | 6.9% | 7.5% |
| Quant Arbitrage | 0.2% | 7.7% | NA |
| HDFC Flexicap | 2.7% | 6.1% | 18.1% |
What Investors Sold
| Most sold MF | 1W | 1Y | 3Y |
|---|---|---|---|
| Nippon India Nifty IT Index | -1.9% | -14.3% | NA |
| Whiteoak Capital Multi Asset Allocation | -0.7% | 7.3% | 16.0% |
| Motilal Oswal Gold & Silver Passive FoF | -10.6% | -0.9% | 25.1% |
| Quant Mid Cap | -1.4% | 2.1% | 9.7% |
| Nippon India Silver ETF FoF | -13.0% | -1.6% | 26.3% |
Most Watchlisted
Mutual Fund Watchlist | 1W | 1Y | 3Y |
|---|---|---|---|
| Parag Parikh Flexi Cap | -0.1% | 0.4% | 12.8% |
| Bandhan Small Cap | -0.9% | 9.0% | 21.2% |
| Invesco India Midcap | 1.7% | 11.9% | 24.0% |
| HDFC Pharma & Healthcare | 0.8% | 32.2% | 30.7% |
| Invesco India Small Cap | 0.6% | 19.8% | 21.0% |
Stocks Watchlist | 1W | 1Y | 5Y |
|---|---|---|---|
| SBI Gold ETF | -9.5% | 20.6% | NA |
| Jio Platforms | -0.9% | NA | NA |
| Redington | -5.2% | 12.7% | 20.3% |
| Mirae Asset NYSE FANG+ETF | -6.3% | 31.4% | NA |
| Muthoot Finance | -10.2% | -31.1% | 10.8% |
US Stocks Watchlist | 1W | 1Y | 5Y |
|---|---|---|---|
| Taiwan Semiconductor Manufacturing Co. | -14.9% | 29.0% | 20.7% |
| S&P 500 Vanguard ETF | -8.5% | 5.9% | 8.1% |
| Vanguard Total World Stock ETF | 8.5% | 5.5% | 5.6% |
| INVESCO NASDAQ 100 ETF | 10.5% | 4.3% | 8.6% |
| Digital Realty Trust | 10.1% | 3.1% | -0.4% |
Data Source: NSE, BSE & Kuvera.in
Strategies for navigating Market Cycles.
Watch/hear on YouTube:
Start investing through a platform that brings goal planning and investing to your fingertips. Visit kuvera.in to discover Direct Plans and start investing today.
Disclaimer: Mutual Fund investments are subject to market risks. Read all scheme related documents carefully.
Registration granted by SEBI, membership of IAASB (in case of IAs) and certification from NISM in no way guarantee performance of the intermediary or provide any assurance of returns to investors.
Investment in the securities is subject to market risks. Read all the related documents carefully before investing.
The securities quoted are for illustration only and are not recommendatory.
This market update was initially published by Livemint.
#MutualFundSahiHai, #KuveraSabseSahiHai!