

Top news
AMFI’s plan to renew its push for a higher overseas investment cap for mutual funds is broadly seen as a positive development for the industry, as it signals a move towards greater global diversification opportunities for Indian investors. If approved by regulators, it could allow fund houses to allocate more capital to international markets, potentially improving portfolio diversification and access to global growth themes. However, the proposal is still subject to regulatory review, and any final decision will determine how significantly it impacts investment strategies going forward.
The CSM Technologies IPO subscribed 0.66 times on June 25, 2026. The Advit Jewels IPO subscribed 212.63 times on June 25, 2026. The public issue subscribed 95.30 times in the retail category, 174.98 times in the QIB category, and 536.38 times in the NII category.
JM Financial AMC has launched NFO for JM Multi Asset Allocation Growth Direct Plan , TATA AMC has launched NFO for Tata Multi Sector Passive FoF Growth Direct Plan and while HDFC AMC has launched NFO for HDFC Nifty Auto Index Growth Direct Plan
Index Returns
| Index | 1W | 1Y | 3Y | P/E | P/B |
|---|---|---|---|---|---|
| NIFTY 50 | 0.2% | -4.7% | 8.8% | 20.8 | 3.2 |
| NIFTY NEXT 50 | -0.2% | 6.7% | 18.9% | 18.8 | 3.5 |
| S&P BSE SENSEX | 0.4% | -6.8% | 8.9% | 20.9 | 4.1 |
| S&P BSE SMALLCAP | 0.1% | -13.1% | 21.8% | 37.2 | 4.5 |
| S&P BSE MIDCAP | 0.1% | -4.0% | 21.7% | 29.2 | 5.5 |
| NASDAQ 100 | -4.2% | 29.2% | 12.7% | 23.6 | 3.7 |
| S&P 500 | -2.0% | 19.1% | 10.4% | 31.5 | 5.8 |


Best Performers
| Mutual Funds | 1W | 1Y | 3Y |
|---|---|---|---|
| Edelweiss MSCI India Domestic & World Healthcare 45 Index | 3.7% | 17.9% | 21.0% |
| DSP Healthcare Growth | 3.3% | 12.9% | 24.0% |
| PGIM India Global Select Real Estate Sec FoF | 2.7% | 25.4% | 17.4% |
| ICICI Prudential Pharma Healthcare & Diagnostics Growth | 2.1% | 10.0% | 27.5% |
| ICICI Pru Nifty Pharma Index | 2.1% | 14.8% | 23.7% |
| ELSS Tax Saving Funds | 1W | 1Y | 3Y |
|---|---|---|---|
| LIC MF ELSS Tax Saver | 1.4% | -3.2% | 12.1% |
| Franklin India ELSS Tax Saver | 1.0% | -3.5% | 15.5% |
| Sundaram ELSS Tax Saver | 1.0% | -1.8% | 12.2% |
| DSP ELSS Tax Saver | 0.8% | 0.3% | 18.0% |
| JM ELSS Tax Saver | 0.7% | 4.9% | 18.0% |
| Stocks (Market cap < Rs 50k Cr) | 1W | 1Y | 5Y |
|---|---|---|---|
| Oracle Fin | 16.2% | 19.9% | 26.8% |
| Meesho | 13.3% | NA | NA |
| Interglobe Aviation | 11.7% | -2.8% | 25.9% |
| JSW Infrastructure | 10.2% | 7.1% | NA |
| Max Healthcare | 9.5% | -6.3% | 34.5% |
Worst Performers
| Mutual Funds | 1W | 1Y | 3Y |
|---|---|---|---|
| Zerodha Silver ETF FoF | -6.9% | NA | NA |
| HDFC Silver ETF FoF | -6.7% | 100.8% | 44.6% |
| Mirae Asset Silver ETF FoF | -6.7% | NA | NA |
| Nippon India Silver ETF FoF | -6.7% | 100.6% | 44.4% |
| Angel One Silver ETF FoF | -6.6% | NA | NA |
| Stocks (Market cap > Rs 50k Cr) | 1W | 1Y | 5Y |
|---|---|---|---|
| Vedanta | -10.8% | -38.7% | 31.4% |
| National Aluminium | -10.2% | 75.1% | 38.2% |
| Infosys | -10.1% | -34.2% | -4.6% |
| Hindustan Zinc | -9.5% | 17.0% | 14.7% |
| Indian Railway Fin | -8.6% | -33.8% | 32.2% |
What Investors Bought
| Most Bought MF | 1W | 1Y | 3Y |
|---|---|---|---|
| Parag Parikh Flexi Cap | -0.9% | -2.5% | 15.1% |
| Kotak Arbitrage | 0.2% | 6.7% | 7.7% |
| Bandhan Small Cap | 0.3% | 7.1% | 29.6% |
| HDFC Mid Cap | 0.60% | 6.70% | 21.70% |
| Tata Arbitrage | 0.20% | 6.80% | 7.70% |
What Investors Sold
| Most sold MF | 1W | 1Y | 3Y |
|---|---|---|---|
| Whiteoak Capital Multi Asset Allocation | -0.4% | 12.1% | 16.9% |
| Aditya Birla Sun Life Large Cap | 0.1% | -2.9% | 12.4% |
| Motilal Oswal Gold & Silver Passive FoF | -7.2% | 57.4% | 35.7% |
| Edelweiss Flexi Cap | 0.1% | 2.0% | 17.2% |
| Tata Digital India | -2.7% | -21.0% | 6.8% |
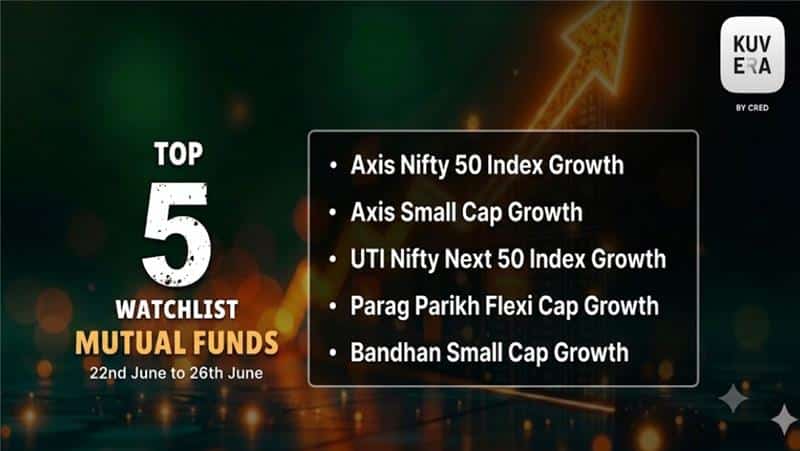
Most Watchlisted
Mutual Fund Watchlist | 1W | 1Y | 3Y |
|---|---|---|---|
| Axis Nifty 50 Index Growth | 0.2% | -3.6% | 9.9% |
| Axis Small Cap Growth | 0.3% | 5.1% | 17.5% |
| UTI Nifty Next 50 Index Growth | -0.2% | 7.4% | 19.6% |
| Parag Parikh Flexi Cap Growth | -0.5% | -2.5% | 15.1% |
| Bandhan Small Cap Growth | 0.2% | 7.1% | 29.6% |
Stocks Watchlist | 1W | 1Y | 5Y |
|---|---|---|---|
| Motilal Oswal NASDAQ 100 ETF | -0.8% | 74.8% | NA |
| Nippon India ETF Gold BeES | -3.4% | 42.2% | NA |
| Mirae Asset NYSE FANG+ETF | -4.6% | 52.7% | NA |
| HDFC Bank | 2.2% | -18.8% | 2.4% |
| ICICI Prudential Nifty Metal ETF | -4.7% | 34.0% | NA |
US Stocks Watchlist | 1W | 1Y | 5Y |
|---|---|---|---|
| Micron Technology Inc. | -6.5% | 818.7% | 69.2% |
| Alphabet Inc. - Class A Shares | -3.5% | 91.5% | 22.4% |
| Taiwan Semiconductor Manufacturing Co. | -2.9% | 116.7% | 30.0% |
| NVIDIA Corporation | -7.7% | 21.9% | 58.8% |
| Palantir Technologies Inc | -5.5% | -17.2% | 33.3% |
Data Source: NSE, BSE & Kuvera.in
Strategies for navigating Market Cycles.
Watch/hear on YouTube:

Start investing through a platform that brings goal planning and investing to your fingertips. Visit kuvera.in to discover Direct Plans and Fixed Deposits and start investing today.
Disclaimer: Mutual Fund investments are subject to market risks. Read all scheme related documents carefully.
Registration granted by SEBI, membership of IAASB (in case of IAs) and certification from NISM in no way guarantee performance of the intermediary or provide any assurance of returns to investors.
Investment in the securities is subject to market risks. Read all the related documents carefully before investing.
The securities quoted are for illustration only and are not recommendatory.
This market update was initially published by Livemint.
#MutualFundSahiHai, #KuveraSabseSahiHai!