Top news
Securities and Exchange Board of India (SEBI) has introduced an addendum to its earlier circular on borrowing by mutual funds, deferring the implementation of guidelines related to intraday borrowings to July 15, 2026, in order to address operational challenges raised by asset management companies.
The IPO of Central Mine Planning was subscribed 1.05 times as of March 24, 2026, while Amir Chand Jagdish Kumar’s IPO was subscribed 3.39 times on March 27, 2026; Powerica’s IPO saw a subscription of 1.53 times, and Sai Parenteral’s IPO was subscribed 1.08 times on the same date.
Zerodha AMC has launched NFO for Zerodha Nifty Midsmallcap400 50:50 Index Growth Direct Plan and Jioblackrock AMC has launched NFO for Jioblackrock Large Cap Growth Direct Plan.
Index Returns
| Index | 1W | 1Y | 3Y | P/E | P/B |
|---|---|---|---|---|---|
| NIFTY 50 | -1.3% | -3.3% | 10.4% | 20.0 | 3.1 |
| NIFTY NEXT 50 | -2.9% | -2.2% | 18.1% | 17.3 | 3.2 |
| S&P BSE SENSEX | -1.3% | -5.2% | 8.9% | 20.2 | 4.0 |
| S&P BSE SMALLCAP | -1.9% | -3.2% | 21.8% | 26.6 | 3.5 |
| S&P BSE MIDCAP | -1.3% | 6.4% | 21.7% | 31.7 | 5.1 |
| NASDAQ 100 | -3.2% | 20.9% | 12.7% | 26.3 | 3.8 |
| S&P 500 | -2.1% | 14.1% | 10.4% | 27.3 | 5.0 |

Best Performers
| Mutual Funds | 1W | 1Y | 3Y |
|---|---|---|---|
| DSP World Gold Mining Overseas Equity Omni FoF | 7.7% | 115.0% | 48.6% |
| DSP World Mining Overseas Equity Omni FoF | 7.2% | 80.2% | 25.0% |
| HSBC Brazil | 6.4% | 56.3% | 23.8% |
| 4.8% | 49.7% | 15.7% | |
| DSP Global Clean Energy Overseas Equity Omni FoF | 4.2% | 63.8% | 17.1% |
| ELSS Tax Saving Funds | 1W | 1Y | 3Y |
|---|---|---|---|
| Edelweiss ELSS Tax Saver | 0.9% | 5.2% | 17.5% |
| JM ELSS Tax Saver | -0.8% | -2.4% | 17.8% |
| ICICI Prudential ELSS Tax Saver | -0.8% | -0.2% | 15.6% |
| Samco ELSS Tax Saver | -0.8% | -4.8% | 6.3% |
| Bank Of India ELSS Tax Saver | -0.9% | 0.8% | 17.9% |
| Stocks (Market cap < Rs 50k Cr) | 1W | 1Y | 5Y |
|---|---|---|---|
| Oracle Financial Services Software | 9.1% | -11.9% | 17.3% |
| Lloyds Metals & Energy | 7.8% | 1.0% | NA |
| Persistent Systems | 6.5% | -11.2% | 40.0% |
| Hindustan Petroleum Corporation | 5.0% | -3.1% | 17.4% |
| Oil & Natural Gas Corporation | 4.8% | 17.6% | 22.5% |
Worst Performers
| Mutual Funds | 1W | 1Y | 3Y |
|---|---|---|---|
| Groww Nifty India Defence ETF FoF | -5.1% | 16.1% | NA |
| UTI Silver ETF FoF | -4.4% | 116.7% | NA |
| Groww Silver ETF FoF | -4.3% | NA | NA |
| Motilal Oswal Gold & Silver Passive FoF | -4.1% | 73.8% | 35.8% |
| Motilal Oswal Nifty India Defence Index | -4.1% | 16.5% | NA |
| Stocks (Market cap > Rs 50k Cr) | 1W | 1Y | 5Y |
|---|---|---|---|
| Lodha Developers | -14.4% | -41.5% | NA |
| IDBI Bank | -8.8% | -17.4% | 10.9% |
| Mazagon Dock Shipbuilders | -8.4% | -18.2% | 82.5% |
| Prestige Estates Projects | -7.5% | -2.0% | 30.7% |
| Bajaj Housing Finance | -7.2% | -34.6% | NA |
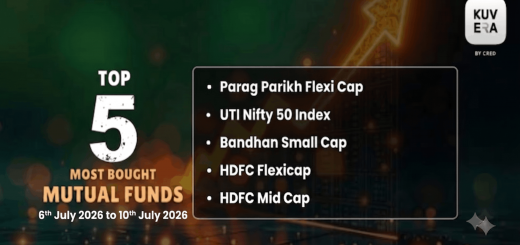
What Investors Bought
| Most Bought MF | 1W | 1Y | 3Y |
|---|---|---|---|
| Parag Parikh Flexi Cap | -1.7% | 1.0% | 18.7% |
| UTI Nifty 50 Index | -1.3% | -2.4% | 11.4% |
| HDFC Flexicap | -1.0% | 1.2% | 19.9% |
| HDFC Mid Cap | -0.4% | 6.7% | 24.6% |
| HDFC Arbitrage Wholesale | 0.1% | 6.8% | 7.6% |
What Investors Sold
| Most sold MF | 1W | 1Y | 3Y |
|---|---|---|---|
| Kotak Gold Silver Passive FoF | -3.4% | NA | NA |
| Kotak Arbitrage | 0.2% | 7.0% | 7.9% |
| Motilal Oswal Midcap | -0.8% | -10.3% | 21.0% |
| Invesco India Gold ETF FoF | -3.1% | 57.2% | 31.9% |
| Tata Gold ETF FoF | -3.1% | 57.6% | NA |
Most Watchlisted
Mutual Fund Watchlist | 1W | 1Y | 3Y |
|---|---|---|---|
| Axis Nifty 50 Index | -1.3% | -2.3% | 11.4% |
| Axis Small Cap | -0.7% | 0.3% | 17.7% |
| UTI Nifty Next 50 Index | -2.8% | -1.5% | 19.0% |
| Parag Parikh Flexi Cap | 0.1% | 1.0% | 18.7% |
| Bandhan Small Cap | -1.2% | 3.5% | 29.7% |
Stocks Watchlist | 1W | 1Y | 5Y |
|---|---|---|---|
| Nippon India ETF Gold BeES | -6.3% | 63.1% | NA |
| Motilal Oswal NASDAQ 100 ETF | 0.2% | 30.6% | 19.5% |
| Hindustan Copper | -1.8% | 123.5% | 300.4% |
| SBI Gold ETF | -6.3% | 63.3% | 25.2% |
| Tata Silver ETF | -5.9% | 134.6% | NA |
US Stocks Watchlist | 1W | 1Y | 5Y |
|---|---|---|---|
| Micron Technology Inc. | -11.7% | 311.1% | 32.3% |
| Global X Uranium ETF | -2.5% | 97.2% | 19.7% |
| Taiwan Semiconductor Manufacturing Co. | -3.5% | 96.8% | 22.9% |
| Global X Copper Miners ETF | 1.1% | 73.3% | 15.2% |
| Palantir Technologies Inc | -11.1% | 69.5% | 44.6% |
Data Source: NSE, BSE & Kuvera.in
Strategies for navigating Market Cycles.
Watch/hear on YouTube:
Start investing through a platform that brings goal planning and investing to your fingertips. Visit kuvera.in to discover Direct Plans and Fixed Deposits and start investing today.
Disclaimer: Mutual Fund investments are subject to market risks. Read all scheme related documents carefully.
Registration granted by SEBI, membership of IAASB (in case of IAs) and certification from NISM in no way guarantee performance of the intermediary or provide any assurance of returns to investors.
Investment in the securities is subject to market risks. Read all the related documents carefully before investing.
The securities quoted are for illustration only and are not recommendatory.
This market update was initially published by Livemint.
#MutualFundSahiHai, #KuveraSabseSahiHai!