Top news
Exit loads are becoming more flexible and investor-friendly, with many equity funds reducing or removing the traditional 1% one-year exit load, while non-equity funds already have minimal charges. This shift is driven by rising SIP participation, long-term investing behavior, and increased competition among fund houses. Despite the reduction, exit loads still play a role in managing liquidity, reflecting a balanced approach between flexibility and disciplined investing.
The IPO of OnEMI Technology, worth ₹925.92 crore, opened on April 30, 2026, and will close on May 5, with a price band of ₹162–₹171. The minimum retail investment is ₹14,877. On Day 1, it was subscribed 0.25x, led by QIB interest, with a listing expected on May 8, 2026.
The Invesco India AMC has launched NFOs for Invesco India Nifty Bank Index Growth Direct Plan and Invesco India BSE Sensex Index Growth Direct Plan, Quant AMC has launched SIF for Qsif Sector Rotation Long Short Growth Direct Plan; and TATA AMC has launched SIF for Titanium Equity Long Short Growth Direct Plan.
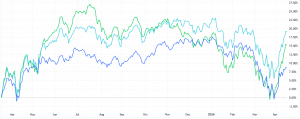
Index Returns
| Index | 1W | 1Y | 3Y | P/E | P/B |
|---|---|---|---|---|---|
| NIFTY 50 | -0.7% | -1.4% | 9.9% | 20.9 | 3.3 |
| NIFTY NEXT 50 | -1.1% | 8.0% | 20.7% | 19.7 | 3.7 |
| S&P BSE SENSEX | -1.0% | -4.2% | 8.9% | 20.9 | 4.1 |
| S&P BSE SMALLCAP | -1.9% | -3.2% | 21.8% | 29.2 | 3.4 |
| S&P BSE MIDCAP | -1.3% | 6.4% | 21.7% | 33.1 | 4.6 |
| NASDAQ 100 | 1.5% | 37.8% | 12.7% | 27.5 | 4.3 |
| S&P 500 | 0.9% | 27.1% | 10.4% | 31.1 | 5.7 |

Best Performers
| Mutual Funds | 1W | 1Y | 3Y |
|---|---|---|---|
| ICICI Prudential Pharma Healthcare & Diagnostics | 3.6% | 8.0% | 28.2% |
| Motilal Oswal Nifty Midsmall IT & Telecom Index | 3.5% | -8.6% | NA |
| Groww Nifty Ev & New Age Automotive ETF FoF | 3.1% | 10.7% | NA |
| ITI Small Cap | 3.0% | 13.9% | 27.3% |
| SBI Healthcare Opportunities | 3.0% | 5.6% | 26.2% |
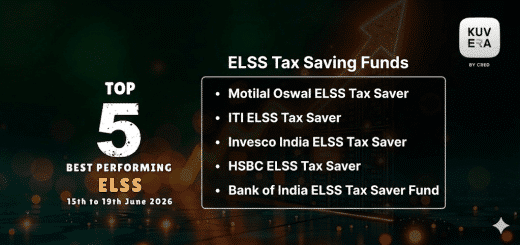
| ELSS Tax Saving Funds | 1W | 1Y | 3Y |
|---|---|---|---|
| Bajaj Finserv ELSS Tax Saver | 2.0% | 6.3% | NA |
| ITI ELSS Tax Saver | 1.5% | 10.6% | 21.2% |
| Motilal Oswal ELSS Tax Saver | 1.4% | 16.9% | 26.4% |
| Bandhan ELSS Tax Saver | 0.9% | 4.3% | 15.2% |
| Edelweiss ELSS Tax Saver | 0.9% | 9.0% | 17.7% |
| Stocks (Market cap < Rs 50k Cr) | 1W | 1Y | 5Y |
|---|---|---|---|
| Oracle Financial Services Software | 19.7% | 10.1% | 22.9% |
| Hitachi Energy India | 10.6% | 133.1% | 79.4% |
| Dr. Reddy's Laboratories | 8.7% | 12.5% | 5.3% |
| Coal India | 8.4% | 23.7% | 30.3% |
| Sun Pharmaceutical Industries | 8.3% | 0.2% | 22.9% |
Worst Performers
| Mutual Funds | 1W | 1Y | 3Y |
|---|---|---|---|
| SBI BSE PSU Bank Index | -3.9% | 28.4% | NA |
| Groww Nifty PSU Bank Index | -3.8% | NA | NA |
| ICICI Prudential Nifty Bank Index | -2.2% | 0.2% | 8.9% |
| Nippon India Nifty Bank Index | -2.2% | 0.1% | NA |
| Axis Nifty Bank Index | 2.2% | 0.1% | NA |
| Stocks (Market cap > Rs 50k Cr) | 1W | 1Y | 5Y |
|---|---|---|---|
| Union Bank Of India | -14.5% | 29.3% | 36.7% |
| Shriram Finance | -10.3% | 52.5% | 27.0% |
| APL Apollo Tubes | -10.2% | 19.1% | 23.4% |
| Ashok Leyland | -9.4% | 42.3% | 23.0% |
| Waaree Energies | -9.0% | 16.9% | NA |
What Investors Bought
| Most Bought MF | 1W | 1Y | 3Y |
|---|---|---|---|
| Parag Parikh Flexi Cap | 0.2% | 4.4% | 17.7% |
| Bandhan Small Cap | 0.2% | 15.1% | 32.3% |
| UTI Nifty 50 Index | -0.7% | -0.5% | 11.0% |
| HDFC Flexicap | -1.6% | 1.9% | 19.6% |
| HDFC Mid Cap | -1.3% | 11.4% | 24.4% |
What Investors Sold
| Most sold MF | 1W | 1Y | 3Y |
|---|---|---|---|
| Motilal Oswal Gold & Silver Passive FoF | -0.8% | 78.1% | 37.1% |
| Tata Digital India | -1.9% | -11.2% | 9.8% |
| Quant Mid Cap | 0.3% | 1.7% | 18.0% |
| JM Flexicap | 0.1% | 0.2% | 20.1% |
| Quant Multi Cap | -0.4% | 4.9% | 13.3% |
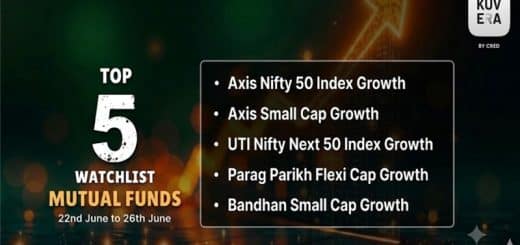
Most Watchlisted
Mutual Fund Watchlist | 1W | 1Y | 3Y |
|---|---|---|---|
| Axis Nifty 50 Index | -0.7% | -0.4% | 11.5% |
| Axis Small Cap | 0.6% | 9.6% | 19.1% |
| UTI Nifty Next 50 Index | -1.6% | 8.7% | 21.4% |
| Parag Parikh Flexi Cap | 0.2% | 4.4% | 17.7% |
| Bandhan Small Cap | 0.3% | 15.1% | 32.3% |
Stocks Watchlist | 1W | 1Y | 5Y |
|---|---|---|---|
| Motilal Oswal NASDAQ 100 ETF | 3.4% | 57.3% | 20.2% |
| Nippon India ETF Gold BeES | -0.3% | 57.2% | 24.8% |
| Tata Silver ETF | -0.2% | 150.4% | NA |
| Mirae Asset NYSE FANG+ETF | 2.6% | 46.3% | NA |
| Reliance Industries Ltd | 9.4% | 2.2% | 9.4% |
US Stocks Watchlist | 1W | 1Y | 5Y |
|---|---|---|---|
| Micron Technology Inc. | 3.4% | 574.2% | 44.4% |
| Rocket Lab USA Inc | -4.2% | 250.6% | 49.7% |
| Taiwan Semiconductor Manufacturing Co. | -1.8% | 125.4% | 27.8% |
| Global X Uranium ETF | 0.9% | 120.6% | 16.0% |
| Global X Copper Miners ETF | 3.1% | 107.6% | 14.9% |
Data Source: NSE, BSE & Kuvera.in
Strategies for navigating Market Cycles.
Watch/hear on YouTube:
Start investing through a platform that brings goal planning and investing to your fingertips. Visit kuvera.in to discover Direct Plans and Fixed Deposits and start investing today.
Disclaimer: Mutual Fund investments are subject to market risks. Read all scheme related documents carefully.
Registration granted by SEBI, membership of IAASB (in case of IAs) and certification from NISM in no way guarantee performance of the intermediary or provide any assurance of returns to investors.
Investment in the securities is subject to market risks. Read all the related documents carefully before investing.
The securities quoted are for illustration only and are not recommendatory.
This market update was initially published by Livemint.
#MutualFundSahiHai, #KuveraSabseSahiHai!