Top news
The Securities and Exchange Board of India ( SEBI ) has announced simplifications to the accredited investor framework for AIFs, allowing investment managers to finalize contribution agreements based on their eligibility assessment (pending accreditation certification, which must precede corpus inclusion and fund receipt), eliminating the need for detailed net worth break-ups in certificates while making net worth specification optional for chartered accountants, with immediate effect and compliance required in AIFs' Compliance Test Reports.
The IPO of Bharat Coking Coal's was subscribed 143.85 times on January 13, 2026, while Amagi Media Labs' IPO achieved 30.20 times subscription on January 16, 2026..
Kotak AMC has launched NFO for Kotak Nifty200 Value 30 Index Growth Direct Plan whereas Bandhan AMC has launched NFO for Bandhan Gold ETF FoF Growth Direct Plan & Bandhan Silver ETF FoF Growth Direct Plan
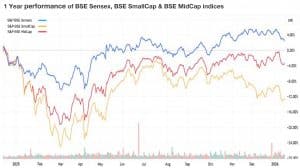
Index Returns
| Index | 1W | 1Y | 3Y | P/E | P/B |
|---|---|---|---|---|---|
| NIFTY 50 | 0.1% | -1.7% | 12.6% | 22.4 | 3.5 |
| NIFTY NEXT 50 | 0.1% | -0.7% | 17.7% | 20.0 | 3.6 |
| S&P BSE SENSEX | 0.2% | -1.9% | 8.9% | 23.1 | 4.5 |
| S&P BSE SMALLCAP | -0.5% | -3.5% | 21.8% | 31.2 | 3.5 |
| S&P BSE MIDCAP | 0.2% | -1.6% | 21.7% | 32.0 | 4.9 |
| NASDAQ 100 | -0.9% | 19.1% | 12.7% | 36.0 | 4.8 |
| S&P 500 | -0.4% | 15.7% | 10.4% | 31.3 | 5.6 |
Best Performers
| Mutual Funds | 1W | 1Y | 3Y |
|---|---|---|---|
| ABSL Silver ETF FoF | 17.4% | 203.6% | 57.1% |
| UTI Silver ETF FoF | 17.3% | 200.8% | NA |
| Zerodha Silver ETF FoF | 17.3% | NA | NA |
| ICICI Pru Silver ETF FoF | 17.1% | 202.1% | 56.7% |
| SBI Silver ETF FoF | 17.0% | 205.9% | NA |
| ELSS Tax Saving Funds | 1W | 1Y | 3Y |
|---|---|---|---|
| Motilal Oswal ELSS Tax Saver | 1.2% | -0.1% | 23.8% |
| Bank of India ELSS Tax Saver | 0.7% | 2.3% | 17.4% |
| SBI ELSS Tax Saver | 0.6% | 8.7% | 23.8% |
| Quantum ELSS Tax Saver | 0.6% | 6.6% | 17.6% |
| Sundaram ELSS Tax Saver | 0.5% | 10.4% | 15.5% |
| Stocks (Market cap < Rs 50k Cr) | 1W | 1Y | 5Y |
|---|---|---|---|
| Vedanta | 13.1% | 56.9% | 31.2% |
| Oil India | 9.4% | -3.3% | 41.8% |
| Union Bank Of India | 9.1% | 66.0% | 40.1% |
| IndusInd Bank | 8.0% | -0.9% | -0.3% |
| Hindustan Zinc | 8.0% | 44.3% | 18.4% |
Worst Performers
| Mutual Funds | 1W | 1Y | 3Y |
|---|---|---|---|
| Tata Nifty Realty Index | -2.4% | -6.5% | NA |
| HDFC NIFTY Realty Index | -2.4% | -6.4% | NA |
| ICICI Pru Nifty Pharma Index | -2.4% | 1.7% | 20.9 |
| Nippon India Nifty Realty Index | -2.4% | -6.6 | NA |
| Motilal Oswal Nifty MidSmall India Consumption Index | -1.9% | -3.5 | NA |
| Stocks (Market cap > Rs 50k Cr) | 1W | 1Y | 5Y |
|---|---|---|---|
| GE Vernova T&D India | -12.7% | 38.4% | 83.8% |
| Hitachi Energy India | -12.1% | 28.0% | 66.2% |
| Dixon Technologies (India) | -10.5% | -36.6% | 29.2% |
| Godrej Properties | -9.8% | -18.1% | 6.5% |
| Adani Energy Solutions | -8.6% | 16.5% | 16.0% |
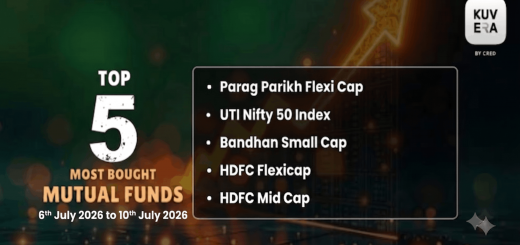
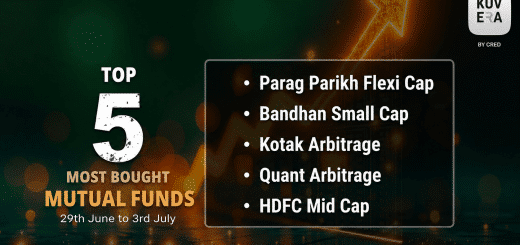
What Investors Bought
| Most Bought MF | 1W | 1Y | 3Y |
|---|---|---|---|
| Parag Parikh Flexi Cap | -1.4% | 9.9% | 22.1% |
| Axis Silver FoF | 12.8% | 200.7% | 56.9% |
| UTI Nifty 50 Index | -1.8% | 11.9% | 13.7% |
| HDFC Flexicap | -1.2% | 15.3% | 22.4% |
| ICICI Prudential Nifty 50 Index | -1.8% | 11.8% | 13.6% |
What Investors Sold
| Most sold MF | 1W | 1Y | 3Y |
|---|---|---|---|
| HDFC Arbitrage Wholesale | 0.1% | 6.9% | 7.6% |
| TrustMF Small Cap | -2.9% | 6.0% | NA |
| Invesco India Large & Mid Cap | -3.1% | 11.0% | 24.5% |
| Quant Flexi Cap | -4.0% | 4.6% | 16.1% |
| Motilal Oswal Nifty Microcap 250 Index | -4.2% | -7.7% | NA |
Most Watchlisted
Mutual Fund Watchlist | 1W | 1Y | 3Y |
|---|---|---|---|
| Axis Nifty 50 Index | 0.1% | 11.9% | 13.9% |
| Axis Small Cap | 0.1% | 1.3% | 18.6% |
| UTI Nifty Next 50 Index | 0.5% | 7.3% | 18.2% |
| Parag Parikh Flexi Cap | -1.4% | 9.9% | 22.0% |
| HDFC Flexicap | 0.3% | 14.5% | 22.4% |
Stocks Watchlist | 1W | 1Y | 5Y |
|---|---|---|---|
| Nippon India ETF Gold BeES | 3.9% | 77.8% | NA |
| Hindustan Copper | 9.6% | 154.3% | 54.6% |
| Tata Silver ETF | 17.8% | 209.5% | NA |
| Motilal Oswal NASDAQ 100 ETF | 0.1% | 23.1% | NA |
| Nippon India Silver ETF | 16.9% | 208.6% | NA |
US Stocks Watchlist | 1W | 1Y | 5Y |
|---|---|---|---|
| Palantir Technologies | -3.7% | 138.2% | 46.1% |
| Rigetti Computing | 3.6% | 160.6% | NA |
| Advanced Micro Devices | 11.6% | 90.9% | 21.3% |
| Alphabet | -0.6% | 68.4% | 30.7% |
| NVIDIA | 0.7% | 35.2% | 70.5% |
Data Source: NSE, BSE & Kuvera.in
Strategies for investing in international market.
Watch/hear on YouTube:
Start investing through a platform that brings goal planning and investing to your fingertips. Visit kuvera.in to discover Direct Plans and Fixed Deposits and start investing today.
Disclaimer: Mutual Fund investments are subject to market risks. Read all scheme related documents carefully.
Registration granted by SEBI, membership of IAASB (in case of IAs) and certification from NISM in no way guarantee performance of the intermediary or provide any assurance of returns to investors.
Investment in the securities is subject to market risks. Read all the related documents carefully before investing.
The securities quoted are for illustration only and are not recommendatory.
This market update was initially published by Livemint.
#MutualFundSahiHai, #KuveraSabseSahiHai!