If you haven’t been sold a moving average momentum strategy, you will be sold one soon. It is the simplest momentum-based quantitative strategy and the backtest can be set up easily in excel – thus its widespread availability.
What is it?
A simple moving average strategy comprises two signals:
1/ A short-term moving average – say average price over the past 21 days.
2/ A long-term moving average – say average price over the past 200 days.
When the short-term moving average crosses above the longer-term moving average, you buy the stock or fund in the belief that the trend is picking up (known as a “golden crossover”). When the short-term moving average crosses below the longer-term moving average, you sell the stock or fund (known as a “death cross”).
So far so good and a really simple strategy setup as you will agree.
The problem is these strategies are sold as something of a market truth. As in the 200 days moving average or the 10 months moving average or an exponential moving average captures some truth about how investor behave and thus these strategies will always work. What is closer to the truth is that the strategy being sold to you has been fitted to the past data to show the highest returns for the least amount of risk. And the strategy returns you are shown will not manifest in the future.
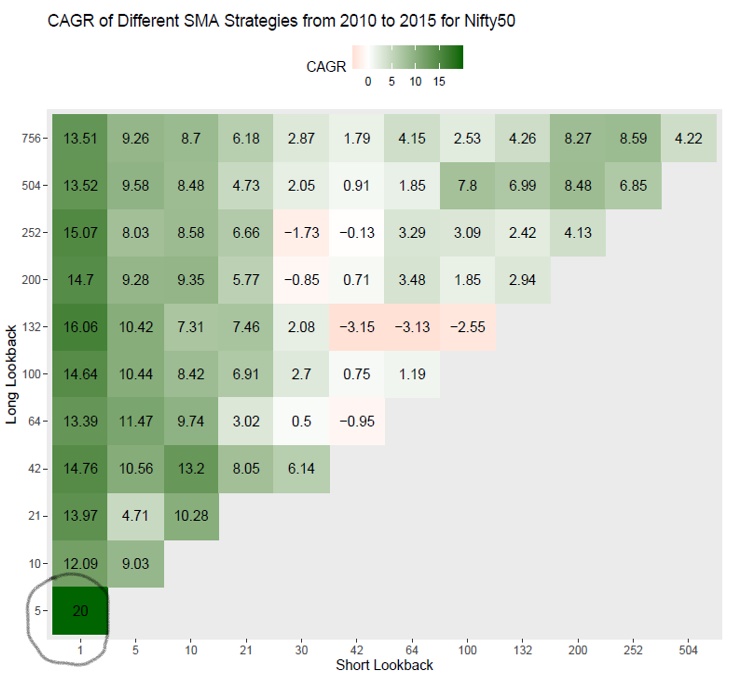
Below is an example from Prof Ben’s blog on moving averages we published this week. Below table shows the return of different moving averages crossover strategies from 2010 – 2015. These are before cost, but still instructive for our purpose. As you will see that using a 1-day short-term moving average and 5-day long-term moving average did the best in this time period delivering 20% CAGR before transaction costs.
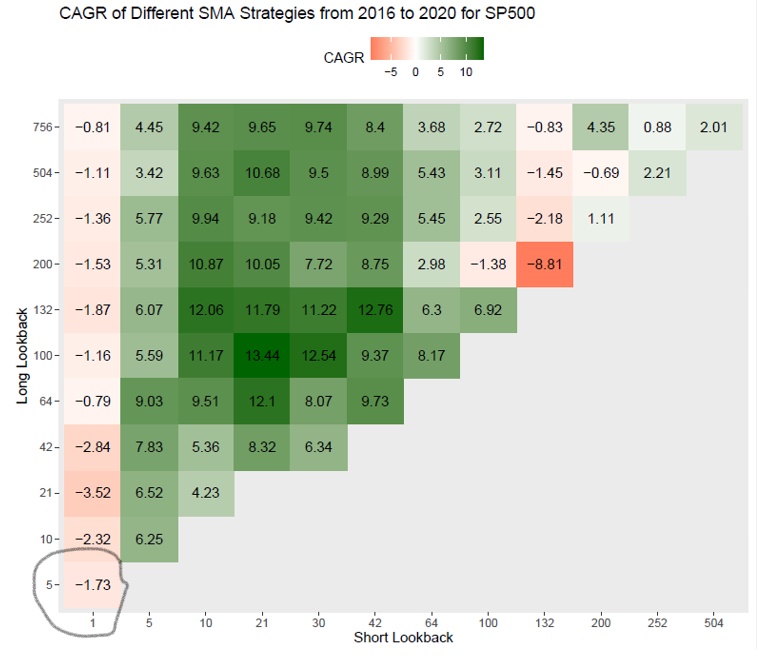
Fast forward to 2016-2020.
The winner strategy of 2010-2015 not only didn’t do well, but it also lost money! Down 1.73% per year in a bull market is kind of hard to believe for a momentum strategy and that too before transaction costs.
As Prof Ben of NUS says most investment advisers will not show you the above charts or the out-of-sample performance of these simple momentum strategies but will present the best performing strategy in past data, and pitch it to you with some kind of story about human behaviour being predictable.
Read Prof Ben’s note here where he lays out all the questions you need to ask your adviser if they are looking to sell you a moving average or any such momentum strategy. It is a must-read if you want to avoid disappointment when the promised returns based on the backtest are not delivered.
On this episode of #KuveraInsights we bring you a session by Gaurav Rastogi, Founder & CEO – Kuvera.in at the Women In Tech virtual conference – #WiTSPARK 2020. Gaurav addressed several questions that a ‘yet to be an entrepreneur’ faces while on the crossroads of ‘taking the plunge’. “It ain’t easy and yet the journey’s exhilarating,” says Gaurav.
Mutual fund industry witnessed an inflow of Rs 1.24 lakh crore during the quarter ended in June 2020. In comparison, mutual funds saw an outflow of Rs 94,200 crore during the preceding quarter. Liquid funds witnessed the most traction with inflows of Rs 86,493 crore. Equity funds saw inflows of Rs 11,710 crore during this period. The overall industry AUM rose by 14.5% to Rs 25.49 lakh crore in the quarter ended in June, while AUM of equity-oriented mutual funds increased 21% to Rs 7.01 lakh crore.
|
|
|
|
|
|
|
|
Announcement
1/ Edelweiss Mutual Fund has appointed Prannav Shah as Head – Compliance and key personnel of Edelweiss Asset Management Limited, effective from 31 July 2020.
2/ Sundaram Mutual Fund has announced a change in fund management responsibilities of relevant schemes.
3/ Taurus AMC settled a case with SEBI by paying Rs 1.94 crore as settlement charges. The case was pertaining to the default of debt obligations by Ballarpur Industries Limited (BILT), further to which four schemes of Taurus MF witnessed a single day dip of 7-11% in February 2017. The case has been settled by the AMC without any admission or denial of allegations.
Quote of the week:
If you are offered a seat on a rocket ship,
do not ask what seat!Just get on.
: Sheryl Sandberg
Interested in how we think about the markets?
Read more: Zen And The Art Of Investing
Watch/hear on YouTube:
Start investing through a platform that brings goal planning and investing to your fingertips. Visit kuvera.in to discover Direct Plans and start investing today.
#MutualFundSahiHai, #KuveraSabseSahiHai!