Ben Charoenwong is an assistant professor of finance at the National University of Singapore Business School doing research on financial regulation around investment advice and also a co-founder and head of research at Chicago Global, a quantitative global investment fund.
Sai Teja Aravapalli is a Masters of Science in Finance student and research assistant at the National University of Singapore.
Gaurav here – Ben is one of the finest quant minds I know, and that’s not simply because we share an alma-mater 🙂 If you have wondered about moving average strategies or have been sold one or have been shown returns of one and how good they are, then read this piece to the end. Data can be stressed to show what one wants to, it can be used to sell greed to us and Ben and Sai know all the tricks advisers use. They are here to guide you on the question you need to ask your adviser to ensure they are not just selling you a backseat.
Quick takeaway:
- Different simple moving crossover strategies work differently in different markets.
- The best performing strategies even in the same market are not consistent over time.
- The most commonly-used 21-day short lookback and 200-day long lookback strategy does not consistently beat a buy-and-hold strategy in the U.S. or India over the past 10 years or 5-year subperiods.
- Including transaction costs like commissions and taxes will make these strategies look even worse.
- Quantitative strategies that are very sensitive to slightly different parameters, such as this SMA crossover strategy, should raise a red flag warning to you about overfitting concerns.
- If investors have the self-discipline to be invested in the market over the long-run even through drawdowns, then these strategies do not appear to add much value.
Various technical analysis traders, financial bloggers, and investment advisers hail the success of simple moving average (SMA) strategies to time the market and beat a buy-and-hold strategy over the long-run. A moving average is a tool commonly used in technical analysis and is defined as the average of recorded price over some fixed time frame, be it minutes, hours, days, or months, creating a constantly updated value as more data flows in and old data flows out.
One of these is the simple moving average crossover strategy. This strategy comprises two signals:
1/ A short-term moving average – say average price over the past 21 days.
2/ A long-term moving average – say average price over the past 200 days.
An SMA crossover strategy as the above would then be written as 21-200 SMA. The short-term moving average filters out noisy price movements and is designed to capture a short-term trend, while the long-term moving average captures a longer-term trend and provides an anchor for relative values to establish a crossover.
When the short-term moving average crosses over above the longer-term moving average, you buy the stock or fund in the belief that the trend is picking up (known as a “golden crossover”). When the short-term moving average crosses below the longer-term moving average, you sell the stock or fund (known as a “death cross”).
This simple strategy has performed well this year. From the beginning of 2020 through July 23, the S&P 500’s year-to-date returns are 1.2% while a 21-200 SMA returned 10.8%. For the Nifty 50, year-to-date returns are -7.7% while a 21-200 SMA returned 13.2%.
Underlying Assumptions and Performance
All strategies have some underlying assumptions or interpretations of why the strategy works. For the SMA crossover, the strategy’s underlying assumption is that there are inherent trends in the stock market prices, and most importantly, that the cross-overs predicts changes in such trends.
Despite the pure mathematical elegance of how the 200-day long-term parameter is almost 10-x the 21-day short-term, is it the best combination of moving averages? Is the conventional wisdom of this 21-200 SMA, corresponding approximately to one trading month and 12-trading month horizons, the best performing strategy?
Let’s take a look at the returns before trading costs.
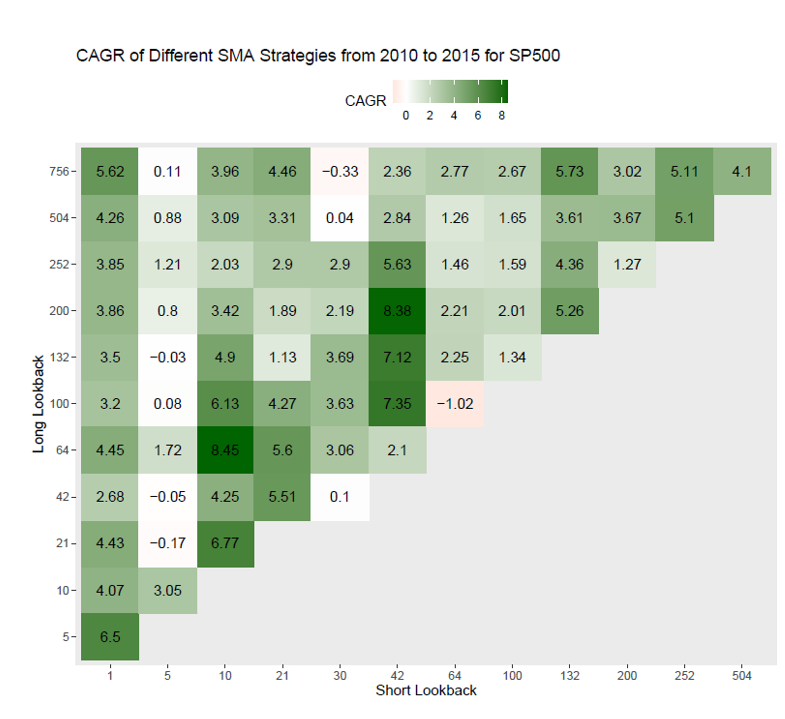
The figure below shows the cumulative annual growth rates (CAGR) from January 2010 to December 2015 for different short and long-horizon moving average parameters. Investing $10,000 in the 21-200 day SMA strategy would return $11,189 whereas the 10-64 day SMA strategy would return $16,270, over 50% better than the 21-200 day strategy. But unfortunately, a simple buy and hold of the S&P 500 over this same period would return $19,280, beating even the best SMA strategy.
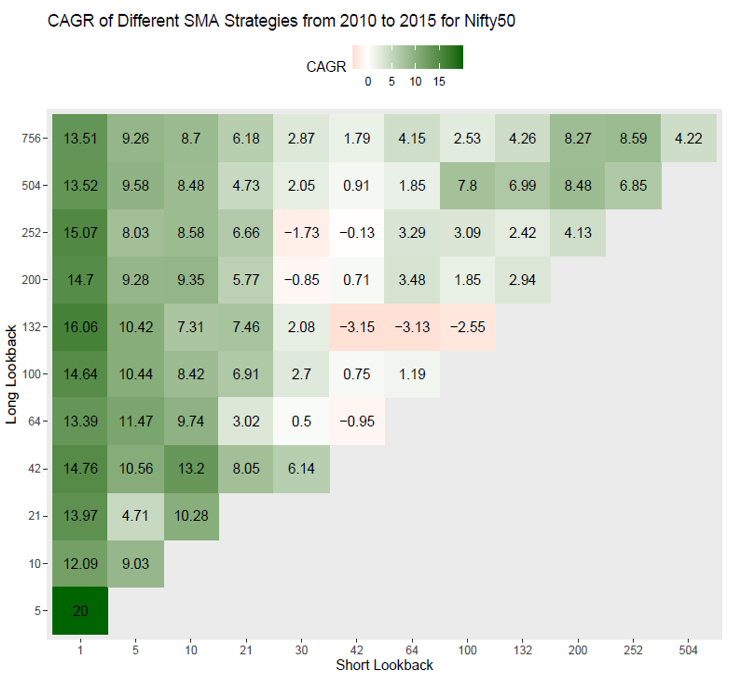
How does the SMA strategy perform in India? The 21-200 strategy would have turned a 10,000 INR investment into 14,000 INR while a 1-5 combination produced a whopping cumulative return of 29,860 INR. Over this same time period, the Nifty 50 had a CAGR of 7.15%, which would turn the 10,000 INR investment to 15,134. So, the conventional wisdom of the 21-200 day SMA doesn’t seem to work that well in this period but the 1-5 combination did well.
Two big takeaways here –
1/ These are performances before transaction costs. Transactions will make the CAGR lower.
2/ The best performing strategy for both the S&P 500 and Nifty 50 from 2010 to 2015 were not the typical 21-200 strategy. Moreover, the best-performing strategy for the S&P 500 does not apply for the Nifty 50.
So, what does that mean for this class of strategies as a whole?
Let’s apply the scientific method. Arguably man’s greatest invention, the scientific method is the process by which we specify hypotheses, then test them in the data through systematic observation. Adopting a scientific approach brings discipline to investment practice.
For example, if we think the SMA strategy captures some truth about investor behaviour, and investors around the world aren’t largely different, then we would expect the same set of parameters to work across countries.
Unfortunately, that hypothesis is not consistent with the data. The 21-200 day cross-over does not do particularly well compared to the other combinations from 2010 to 2015. So, if SMA crossovers capture some kind of economic truth, it doesn’t seem to be driven by the same fundamentals, as the S&P 500 and Nifty 50 have different optimal strategies. Btw, we don’t show the data here, but the optimal strategy will change based on the time period and asset class (country index, sector, gold, silver, commodities, currencies etc) – there is not one SMA that works regardless of such claims.
Let’s test a less restrictive hypothesis that the strategies capture some ground “truth”, but that different markets can have different truths. Quantitatively, this means the optimal strategies for the S&P 500 (the 10-64 strategy) and Nifty (the 1-5 strategy) should be stable across time periods.
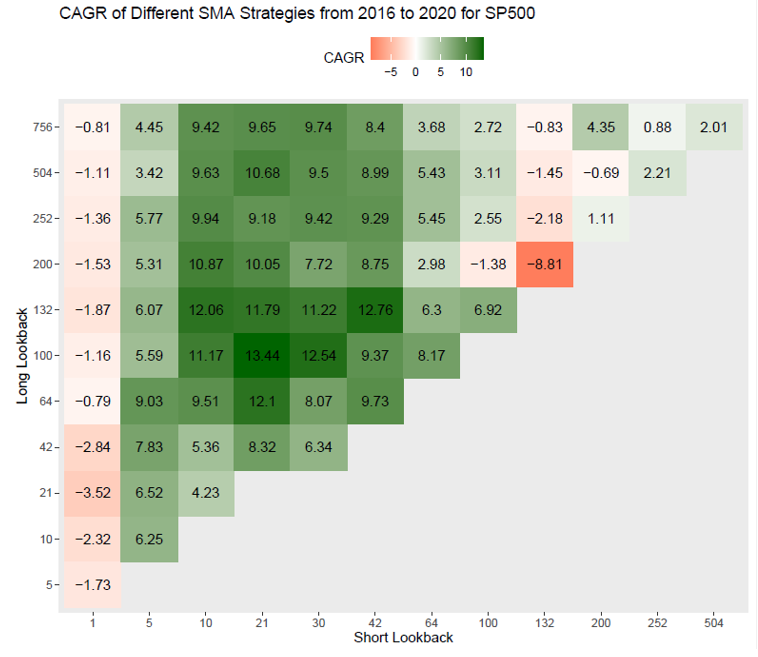
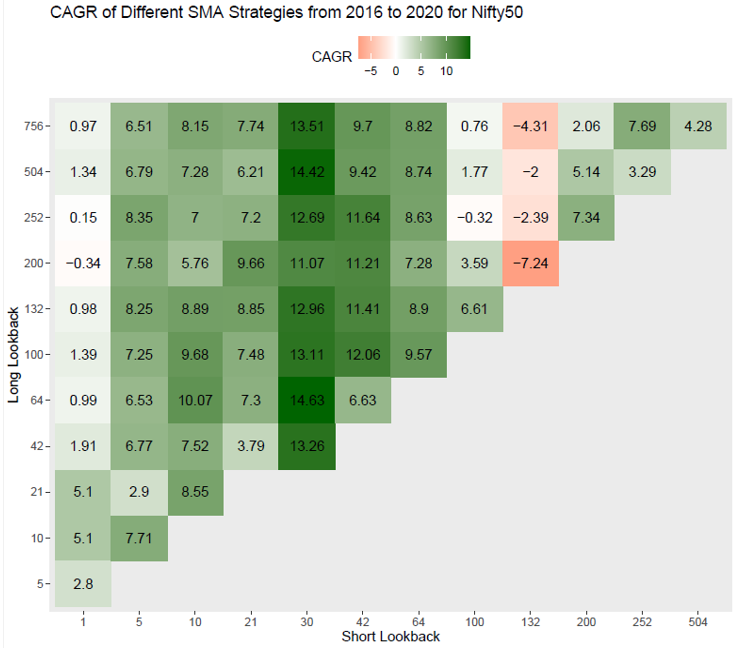
Looking at the same strategies in another time-period from 2016 through July 23, 2020, unfortunately, the hypothesis of stable optimal strategies doesn’t seem to be true either. The S&P 500 10-64 strategy loses out to a handful of other strategies and the Nifty 50 1-5 strategy loses out to any other using the 30-day short term lookback. So, the data suggest this strategy is not capturing some kind of truth. Moreover, the S&P 500 CAGR is 10.7%, beating the majority of SMA strategies considered and roughly equals to the 21-200 strategy. The Nifty 50 CAGR is 7.5%, slightly below the rule-of-thumb 21-200 strategy and beating the 1-5 strategy which was the best performing from 2010 to 2015.
Despite the optimal strategies and performance being unstable in our exploration, one possibility is simply that the sample is too noisy and that 5 years each of training and testing these strategies are not sufficient. That is always possible. Another possibility is that this strategy overfits the data.
Most investment advisers will not show you the above charts or the out-of-performance behaviour of these strategies but will present the best performing strategies, and pitch it to you with some kind of story about human behaviour being predictable.
If all that glitters was simply backtest overfitting, how can investors deal with this in practice?
Buyer Beware
Unless quantitative analysts are disciplined in forming strategies based on some underlying theory or guidelines, they can easily overfit their data. New techniques like exponential moving averages or penalized least squares or constrained optimizers at first appear like a miracle cure, but these penalty parameters or constraints must also be estimated from the data (unless they are pre-specified). No amount of penalties or modelling can bypass that process, as overfitting can always arise unless the data scientist is disciplined. Such is the curse of dimensionality.
Investors considering buying into any financial products or following particular investment advice should consider the possibility that all the historical returns that are being shown are due to overfitting. As data is the new oil, the proliferation of quantitative strategies has increased, but so has overfitting. Investors should beware of such strategies and ask the appropriate questions.
Before buying into any of these strategies, there are five simple questions you should ask:
1/ How did the fund manager or financial adviser come up with the quantitative strategy?
How many strategies were tried before they came up with the product you are seeing? If the financial adviser is not able to answer this question in an intuitive way drawing upon some economic fundamental or behavioural pattern, that is a red flag.
2/ What would the back-tested returns look like if they incorporated trading costs and taxation?
Check that the benchmark returns that they are comparing their returns to are appropriate. If the returns being shown are gross of management fees, trading costs like commissions and the bid-ask spread, and taxation, they will overstate the actual returns you would get.
In addition, keep an eye on the benchmark against which they are evaluating their performance. For example, if they are pitching you a SMA crossover strategy and show the performance relative to inflation, that should raise a red flag as they are comparing apples to oranges. Instead, they should compare the SMA crossover with a simple buy and hold strategy in the same equity market index.
3/ What is the trading universe, and why those set of stocks?
If they are not able to provide a good explanation for why they selected a particular subset of stocks, you should consider how they would implement such strategies going forward. Do the explanations seem to rely on some knowledge now applied to data in the past? For example, if they picked a universe of healthcare stocks to apply the strategy, one may suspect that they only chose that restriction because of the recent COVID-19 pandemic where healthcare stocks did well. You would not have had that knowledge if you were actually trading in the past. This is known as “lookahead bias”, which tends to cause quantitative strategies to perform better on paper than they would in practice. Moreover, lookahead bias is not simply constrained to programming errors, but can also emerge from these subtler considerations such as the trading universe restriction.
4/ How stable is the strategy’s performance?
Different strategies typically correspond to different investment horizons. Are the managers trying to beat the market every week, every month, or over the long-term? If the strategy is designed to capture some fundamental, you should expect to see similar patterns of performance. Better yet, you can ask the adviser to show results for different sub-periods of the data and explain why the strategy works in one setting but not others. If the results are stable, they should be roughly the same if the data are representative. If the strategy is not stable, then the performance may differ wildly and randomly “stop working”.
5/ Lastly, but most importantly, how sensitive if the strategy parameters?
For example, if the adviser is advocating for a 21-200 day SMA crossover strategy, ask for for the performance of the 15-200 day strategy or the 21-252 day strategy. If the strategy is capturing some fundamental, then you could expect the returns to be quite similar. However, if the strategy is due to overfitting, then the results may differ wildly. In addition, you should also ask how quickly does the strategy signal decay? That is, suppose a 21-200 strategy tells you to buy the stock today at the close of the market, but what if you executed it late and only bought the stock tomorrow?
It turns out for overfitting, asking questions like “how did this strategy do during a market downturn” is not so informative, as the answer is typically “it did better than the market”. After all, if it didn’t do better than the market on paper, they would not be trying to sell it to you!
Any investor with access to a financial adviser will be frequently pushed products by the adviser. Investment advisers typically earn fees through commission. So, they don’t really need to give you the best advice, but they just want to encourage you to buy the product.
Many of these questions involve the advisers doing more work and being more careful with the data. They may try to brush off these questions since it is detailed, and you may feel embarrassed for pressuring the advisers, but remember: they work for you. It is important you hold financial advisers accountable as you are trusting them with your hard-earned savings.
The opinions expressed are those of the authors and do not represent the views and opinions of the National University of Singapore, Chicago Global or Kuvera.
Interested in how we think about the markets?
Read more: Zen And The Art Of Investing
Watch/hear on YouTube:
Start investing through a platform that brings goal planning and investing to your fingertips. Visit kuvera.in to discover Direct Plans and start investing today.
#MutualFundSahiHai, #KuveraSabseSahiHai!


Charles
December 11, 2021 AT 22:51
Looking at crossover strategies should examine one or more full market bull bear cycles. The crossover strategy will show its power by reducing losses in a bear market. Something buy and hold obviously cannot do. Measure from March 2000 to October 2007. One cycle top to the next. Or, from March 2000 to Jan 2020 or wait a but and another big multi year top will occur in 2022 or 23.
Gaurav Rastogi
December 15, 2021 AT 01:45
Fair enough