Top news
SEBI has introduced ( SEBI ) a mechanism under the amended SEBI (Issue of Capital and Disclosure Requirements) Regulations, 2018, enabling depositories to mark pledged shares as “non-transferable” during the lock-in period, with mandatory compliance requirements for stock exchanges, depositories, merchant bankers, and issuers to ensure investor protection and market regulation.
The IPO of Property Share Investment Trust (PropShare Celestia SM REIT) is set to raise approximately ₹244.65 crore during April 10–16, 2026, and was subscribed 0.47 times on April 10, 2026.
GROWW AMC has launched NFO for Groww Arbitrage Growth Direct Plan and Kotak AMC has launched NFO for Kotak Multi Asset Active FoF Growth Direct Plan
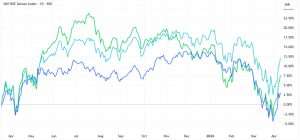
Index Returns
| Index | 1W | 1Y | 3Y | P/E | P/B |
|---|---|---|---|---|---|
| NIFTY 50 | 5.9% | 7.4% | 10.9% | 21.1 | 3.3 |
| NIFTY NEXT 50 | 9.2% | 11.5% | 20.8% | 19.2 | 3.6 |
| S&P BSE SENSEX | 5.8% | 5.0% | 8.9% | 21.3 | 4.2 |
| S&P BSE SMALLCAP | -1.9% | -3.2% | 21.8% | 29.1 | 3.7 |
| S&P BSE MIDCAP | -1.3% | 6.4% | 21.7% | 34.0 | 5.2 |
| NASDAQ 100 | 4.5% | 34.4% | 12.7% | 25.7 | 3.6 |
| S&P 500 | 3.6% | 27.1% | 10.4% | 29.3 | 5.4 |

Best Performers
| Mutual Funds | 1W | 1Y | 3Y |
|---|---|---|---|
| Tata Nifty Realty Index Growth | 12.9% | -2.9% | NA |
| HDFC Nifty Realty Index Growth | 12.9% | -2.8% | NA |
| Nippon India Nifty Realty Index Growth | 12.9% | -2.9% | NA |
| Tata Nifty Capital Markets Index Growth | 11.7% | 50.4% | NA |
| Motilal Oswal Nifty Capital Market Index Growth | 11.7% | 51.1% | NA |
| ELSS Tax Saving Funds | 1W | 1Y | 3Y |
|---|---|---|---|
| Motilal Oswal ELSS Tax Saver | 8.8% | 22.0% | 25.4% |
| ITI ELSS Tax Saver | 8.0% | 11.9% | 19.9% |
| Quant ELSS Tax Saver | 7.5% | 16.5% | 18.1% |
| Tata ELSS | 7.2% | 15.1% | 17.1% |
| Samco ELSS Tax Saver | 7.1% | 9.9% | 7.4% |
| Stocks (Market cap < Rs 50k Cr) | 1W | 1Y | 5Y |
|---|---|---|---|
| Adani Green Energy | 26.8% | 26.1% | -1.8% |
| Adani Energy Solutions | 23.0% | 38.3% | 1.4% |
| Ashok Leyland | 19.9% | 74.0% | 24.2% |
| Lodha Developers | 18.8% | -25.6% | NA |
| 16.6% | 10.5% | 22.7% | |
| Bosch | 16.2% | 42.6% | 20.7% |
Worst Performers
| Mutual Funds | 1W | 1Y | 3Y |
|---|---|---|---|
| SBI Floating Rate Debt Growth | -0.2% | 6.10% | 7.7% |
| Bank Of India Arbitrage Growth | 0.1% | 6.1% | 7.0% |
| NJ Arbitrage Growth | 0.1% | 6.2% | 7.1% |
| ITI Arbitrage Growth | 0.1% | 7.0% | 7.7% |
| Jioblackrock Overnight Growth | 0.1% | NA | NA |
| Stocks (Market cap > Rs 50k Cr) | 1W | 1Y | 5Y |
|---|---|---|---|
| Coal India | -3.4% | 15.9% | 34.6% |
| Sun Pharmaceutical Industries | -2.3% | 0.2% | 23.7% |
| Abbott India | -1.9% | -11.4% | 13.0% |
| Oil India | -1.8% | 34.8% | 44.6% |
| Linde India | -1.5% | 22.0% | 31.7% |
What Investors Bought
| Most Bought MF | 1W | 1Y | 3Y |
|---|---|---|---|
| Parag Parikh Flexi Cap | 4.1% | 7.8% | 18.7% |
| UTI Nifty 50 Index | 5.9% | 8.4% | 12.0% |
| HDFC Flexicap | 6.5% | 11.3% | 21.0% |
| HDFC Mid Cap | 6.6% | 19.5% | 25.0% |
| Bandhan Small Cap | 6.6% | 17.0% | 31.3% |
What Investors Sold
| Most sold MF | 1W | 1Y | 3Y |
|---|---|---|---|
| Invesco India Arbitrage | 0.2% | 6.8% | 7.8% |
| Quant Multi Cap | 6.9% | 6.8% | 13.2% |
| Parag Parikh Dynamic Asset Allocation | 1.5% | 5.0% | NA |
| Whiteoak Capital Multi Asset Allocation | 2.2% | 17.6% | NA |
| Quant Bfsi | 8.4% | 31.3% | NA |
Most Watchlisted
Mutual Fund Watchlist | 1W | 1Y | 3Y |
|---|---|---|---|
| Axis Nifty 50 Index | 5.9% | 8.4% | 12.0% |
| Axis Small Cap | 5.8% | 11.3% | 18.4% |
| UTI Nifty Next 50 Index | 9.2% | 12.3% | 21.4% |
| Parag Parikh Flexi Cap | 4.1% | 7.8% | 18.7% |
| Bandhan Small Cap | 6.7% | 17.0% | 31.3% |
Stocks Watchlist | 1W | 1Y | 5Y |
|---|---|---|---|
| Nippon India ETF Gold BeES | 2.2% | 64.8% | NA |
| Motilal Oswal NASDAQ 100 ETF | 3.7% | 39.9% | NA |
| Hindustan Copper | 5.7% | 170.1% | 29.7% |
| Tata Silver ETF | 3.6% | 156.0% | NA |
| SBI Gold ETF | 2.3% | 65.3% | NA |
US Stocks Watchlist | 1W | 1Y | 5Y |
|---|---|---|---|
| Micron Technology Inc. | 11.3% | 492.2% | 34.6% |
| Global X Copper Miners ETF | 8.7% | 149.9% | 17.4% |
| Taiwan Semiconductor Manufacturing Co. | 6.8% | 133.9% | 24.7% |
| Global X Uranium ETF | 4.3% | 136.0% | 20.4% |
| NVIDIA Corporation | 6.2% | 70.4% | 67.2% |
Data Source: NSE, BSE & Kuvera.in
Strategies for navigating Market Cycles.
Watch/hear on YouTube:
Start investing through a platform that brings goal planning and investing to your fingertips. Visit kuvera.in to discover Direct Plans and Fixed Deposits and start investing today.
Disclaimer: Mutual Fund investments are subject to market risks. Read all scheme related documents carefully.
Registration granted by SEBI, membership of IAASB (in case of IAs) and certification from NISM in no way guarantee performance of the intermediary or provide any assurance of returns to investors.
Investment in the securities is subject to market risks. Read all the related documents carefully before investing.
The securities quoted are for illustration only and are not recommendatory.
This market update was initially published by Livemint.
#MutualFundSahiHai, #KuveraSabseSahiHai!