Top news
India has seen strong foreign portfolio investment (FPI) interest in its debt markets, with cumulative inflows into debt reaching about $95.5 billion over the long term, compared to $19.3 billion in recent years. This shows that global investors have consistently allocated significant capital to Indian fixed-income assets. The trend highlights relatively stable and sustained foreign participation in India’s debt market. Overall, it reflects continued confidence in India’s macroeconomic stability and bond market attractiveness.
The CMR Green Technologies IPO was subscribed 127.07 times on June 5, reflecting strong investor interest across categories. The QIB segment led the demand with 270.46 times subscription, followed by the NII category at 172.35 times while The Hexagon Nutrition IPO was subscribed 53.68 times on June 9, 2026.
Groww MF has launched NFO for Groww Nifty Smallcap 250 Momentum Quality 100 Index Growth Direct Plan and Kotak AMC has launched NFO for Kotak Nifty Alpha Low Volatility 30 Index Growth Direct Plan.
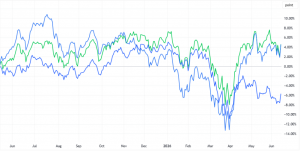
Index Returns
| Index | 1W | 1Y | 3Y | P/E | P/B |
|---|---|---|---|---|---|
| NIFTY 50 | -1.1% | -5.1% | 8.3% | 20.4 | 3.1 |
| NIFTY NEXT 50 | -0.3% | 3.7% | 17.8% | 18.9 | 3.5 |
| S&P BSE SENSEX | 1.7% | -7.6% | 8.9% | 20.0 | 4.0 |
| S&P BSE SMALLCAP | 0.1% | -12.5% | 21.8% | 42.4 | 6.0 |
| S&P BSE MIDCAP | 0.1% | -3.5% | 21.7% | 29.7 | 7.3 |
| NASDAQ 100 | 2.3% | 37.0% | 12.7% | 26.1 | 4.4 |
| S&P 500 | 0.7% | 24.3% | 10.4% | 32.0 | 5.4 |
Best Performers
| Mutual Funds | 1W | 1Y | 3Y |
|---|---|---|---|
| Groww Nifty Private Bank Index Growth | 5.9% | NA | NA |
| UTI Nifty Private Bank Index | 5.8% | 0.0% | NA |
| DSP Nifty Private Bank Index | 5.8% | 0.0% | NA |
| ICICI Pru Nifty Private Bank Index | 5.8% | NA | NA |
| Navi Nifty Bank Index | 5.1% | 0.0% | NA |
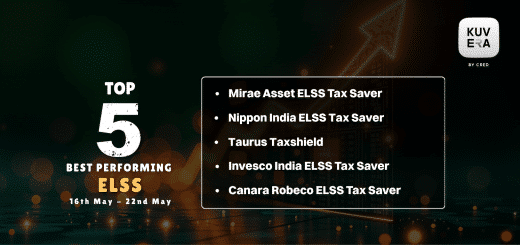
| ELSS Tax Saving Funds | 1W | 1Y | 3Y |
|---|---|---|---|
| LIC MF ELSS Tax Saver | 2.72% | -6.3% | 11.0% |
| DSP ELSS Tax Saver | 2.70% | -1.2% | 17.1% |
| Axis ELSS Tax Saver | 2.66% | -2.2% | 10.8% |
| Invesco India ELSS Tax Saver | 2.61% | -5.3% | 13.6% |
| ITI ELSS Tax Saver | 2.58% | -0.5% | 18.7% |
| Stocks (Market cap < Rs 50k Cr) | 1W | 1Y | 5Y |
|---|---|---|---|
| Coromandel International Ltd. | 8.7% | -19.5% | 17.8% |
| Axis Bank Ltd. | 8.2% | 10.1% | 12.3% |
| ICICI Bank Ltd. | 7.1% | -6.3% | 15.7% |
| JSW Infrastructure Ltd | 6.7% | -6.5% | NA |
| IDFC First Bank Ltd. | 6.0% | 7.3% | 4.0% |
Worst Performers
| Mutual Funds | 1W | 1Y | 3Y |
|---|---|---|---|
| HSBC Gold ETF FoF | -4.5% | NA | NA |
| Edelweiss Gold ETF FoF | -4.3% | NA | NA |
| Edelweiss Gold & Silver ETF FoF | -3.7% | 0.8% | 0.4% |
| Edelweiss Silver ETF FoF | -3.0% | NA | NA |
| Union Gold ETF FoF | -2.1% | 0.5% | NA |
| Stocks (Market cap > Rs 50k Cr) | 1W | 1Y | 5Y |
|---|---|---|---|
| Oil India Ltd. | -14.5% | -10.2% | 38.6% |
| Wipro Ltd. | -11.8% | -30.4% | -6.5% |
| Hindalco Industries Ltd. | -9.2% | 55.9% | 21.5% |
| Oil & Natural Gas Corporation Ltd. | -8.0% | -0.5% | 20.5% |
| Coal India Ltd. | -7.9% | 10.3% | 28.2% |
What Investors Bought
| Most Bought MF | 1W | 1Y | 3Y |
|---|---|---|---|
| Parag Parikh Flexi Cap | -1.3% | -3.6% | 15.2% |
| UTI Nifty 50 Index | 1.1% | -4.2% | 9.3% |
| Bandhan Small Cap | -0.1% | 5.2% | 29.6% |
| HDFC Mid Cap | -0.10% | 4.90% | 21.10% |
| Kotak Arbitrage | 0.20% | 6.40% | 7.70% |
What Investors Sold
| Most sold MF | 1W | 1Y | 3Y |
|---|---|---|---|
| Kotak Equity Saving | 0.30% | 5.50% | 11.00% |
| Kotak Nifty500 Momentum 50 Index | 1.00% | NA | NA |
| HSBC Arbitrage | 0.20% | 6.30% | 7.40% |
| Mirae Asset ELSS Tax Saver | 0.70% | 1.50% | 15.10% |
| Qsif Hybrid Long Short | 0.30% | NA | NA |
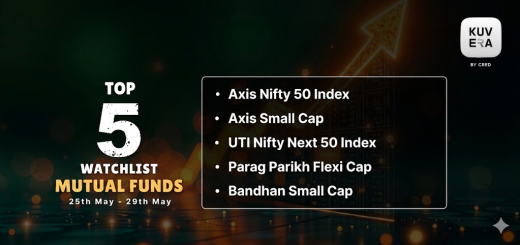
Most Watchlisted
Mutual Fund Watchlist | 1W | 1Y | 3Y |
|---|---|---|---|
| Axis Nifty 50 Index | 2.19 | -4.2% | 9.3% |
| Bandhan Small Cap | 1.82 | 4.0% | 29.0% |
| Axis Small Cap | 1.54 | 2.8% | 16.5% |
| UTI Nifty Next 50 Index | 1.53 | 4.4% | 18.3% |
| Parag Parikh Flexi Cap | -0.17 | -3.6% | 15.2% |
Stocks Watchlist | 1W | 1Y | 5Y |
|---|---|---|---|
| Motilal Oswal NASDAQ 100 ETF | -3.2% | 50.8% | NA |
| Mirae Asset NYSE FANG+ETF | -5.1% | 33.9% | NA |
| Nippon India ETF Gold BeES | -6.8% | 49.0% | 28.2% |
| Nippon India ETF Hang Seng BeES | -3.8% | 13.8% | NA |
| Tata Gold | -6.7% | 48.5% | NA |
US Stocks Watchlist | 1W | 1Y | 5Y |
|---|---|---|---|
| Direxion Daily Semiconductor Bull 3X ETF | 4.9% | 984.2% | 42.8% |
| Micron Technology Inc. | 3.4% | 744.9% | 65.3% |
| PROSHARES ULTRA SEMICONDUCT | 1.8% | 206.2% | 64.6% |
| Taiwan Semiconductor Manufacturing Co. | -2.3% | 96.8% | 29.1% |
| NVIDIA | -1.7% | 40.9% | 62.8% |
Data Source: NSE, BSE & Kuvera.in
Strategies for navigating Market Cycles.
Watch/hear on YouTube:
Start investing through a platform that brings goal planning and investing to your fingertips. Visit kuvera.in to discover Direct Plans and Fixed Deposits and start investing today.
Disclaimer: Mutual Fund investments are subject to market risks. Read all scheme related documents carefully.
Registration granted by SEBI, membership of IAASB (in case of IAs) and certification from NISM in no way guarantee performance of the intermediary or provide any assurance of returns to investors.
Investment in the securities is subject to market risks. Read all the related documents carefully before investing.
The securities quoted are for illustration only and are not recommendatory.
This market update was initially published by Livemint.
#MutualFundSahiHai, #KuveraSabseSahiHai!