Top news
India's economy grew 7.8% year-on-year in the January–March 2026 quarter, outperforming expectations and demonstrating strong economic momentum. Growth was supported by robust private investment, construction activity, agricultural output, and resilient consumer demand. As a result, GDP growth for FY2025-26 is estimated at 7.7%, reinforcing India's position among the world's fastest-growing major economies. While domestic demand remains strong, economists caution that factors such as higher oil prices, inflation, and global uncertainties could impact growth prospects going forward.
Equity mutual funds generated positive returns on SIP investments over the last five years, with several schemes delivering double-digit XIRRs. Leading the pack were HSBC Midcap Fund and Bandhan Small Cap Fund, both posting XIRRs above 20%. The performance underscores the effectiveness of disciplined SIP investing across fund categories, helping investors build substantial long-term wealth through regular contributions.
HSBC MF has launched NFO for Redhex Hybrid Long Short Growth Direct Plan, Motilal Oswal AMC has launched NFO for Motilal Oswal BSE Clean Environment Index Growth Direct Plan and 360 One Asset AMC has launched NFO for Dynasif Equity Ex Top 100 Long Short Growth Direct Plan.
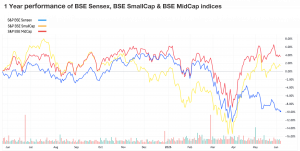
Index Returns
| A | B | C | D | E | F |
|---|---|---|---|---|---|
| Index | 1W | 1Y | 3Y | P/E | P/B |
| NIFTY 50 | -0.8% | -5.6% | 8.0% | 20.2 | 3.1 |
| NIFTY NEXT 50 | -1.2% | -21.8% | 18.2% | 19.0 | 3.6 |
| S&P BSE SENSEX | -0.7% | -8.8% | 8.9% | 20.1 | 4.0 |
| S&P BSE SMALLCAP | -0.1% | -12.0% | 21.8% | 48.2 | 4.2 |
| S&P BSE MIDCAP | 1.0% | -3.1% | 21.7% | 32.6 | 5.8 |
| NASDAQ 100 | -4.7% | 31.6% | 12.7% | 26.3 | 4.1 |
| S&P 500 | -2.6% | 23.1% | 10.4% | 31.8 | 5.9 |

Best Performers
| Mutual Funds | 1W | 1Y | 3Y |
|---|---|---|---|
| Mirae Asset NYSE FANG ETF FoF | 4.6% | 51.9% | 51.3% |
| Motilal Oswal Active Momentum | 3.3% | 24.7% | NA |
| ICICI Prudential Strategic Metal & Energy Equity FoF | 2.7% | 73.4% | 33.1% |
| HSBC Asia Pacific Dividend Yield | 2.4% | 63.6% | 29.1% |
| Mirae Asset Hang Seng Tech ETF FoF | 2.3% | 11.1% | 21.7% |
| ELSS Tax Saving Funds | 1W | 1Y | 3Y |
|---|---|---|---|
| Motilal Oswal ELSS Tax Saver | 1.1% | 5.1% | 24.2% |
| ITI ELSS Tax Saver | 0.2% | -0.8% | 18.8% |
| Whiteoak Capital ELSS Tax Saver | 0.1% | -0.6% | 18.3% |
| HSBC ELSS Tax Saver | -0.1% | 2.3% | 17.3% |
| PGIM India ELSS Tax Saver | -0.1% | -4.3% | 9.5% |
| Stocks (Market cap < Rs 50k Cr) | 1W | 1Y | 5Y |
|---|---|---|---|
| Vodafone Idea | 5.4% | 116.4% | 8.9% |
| The Federal Bank | 5.3% | 44.2% | 28.2% |
| Thermax | 5.3% | 37.5% | 26.3% |
| GMR Airports | 4.3% | 21.5% | 33.3% |
| Coforge | 3.4% | -16.8% | 14.2% |
Worst Performers
| Mutual Funds | 1W | 1Y | 3Y |
|---|---|---|---|
| Tata Nifty Capital Markets Index | -3.7% | 16.0% | NA |
| Motilal Oswal Nifty Capital Market Index | -3.7% | 16.4% | NA |
| Axis Nifty Capital Markets Index | -3.6% | NA | NA |
| Groww Nifty Capital Markets ETF FoF | -3.4% | NA | NA |
| Kotak Nifty Financial Services Ex Bank Index | -3.3% | 2.2% | NA |
| Stocks (Market cap > Rs 50k Cr) | 1W | 1Y | 5Y |
|---|---|---|---|
| PB Fintech | -14.1% | -16.7% | NA |
| Hindustan Zinc | -12.7% | 21.1% | 11.2% |
| Ashok Leyland | -11.2% | 23.3% | 17.7% |
| Ambuja Cements | -9.2% | -24.4% | 4.7% |
| NTPC | -9.2% | 9.8% | 26.5% |
What Investors Bought
| Most Bought MF | 1W | 1Y | 3Y |
|---|---|---|---|
| Parag Parikh Flexi Cap | -1.5% | -0.3% | 15.5% |
| UTI Nifty 50 Index | -0.7% | -4.8% | 8.9% |
| HDFC Flexicap | -0.6% | -0.1% | 17.6% |
| HDFC Mid Cap | -0.4% | 5.3% | 22.0% |
| Bandhan Small Cap | -0.1% | 5.2% | 29.6% |
What Investors Sold
| Most sold MF | 1W | 1Y | 3Y |
|---|---|---|---|
| Zerodha Multi Asset Passive FoF | -1.0% | NA | NA |
| Aditya Birla Sun Life Arbitrage | 0.4% | 6.4% | 7.6% |
| Navi Nasdaq 100 FoF | 1.6% | 56.3% | 34.7% |
| Invesco India Focused | -0.2% | -5.5% | 21.4% |
| Edelweiss Arbitrage | 0.4% | 6.4% | 7.6% |
Most Watchlisted
Mutual Fund Watchlist | 1W | 1Y | 3Y |
|---|---|---|---|
| Axis Nifty 50 Index | -0.7% | -4.7% | 8.9% |
| Axis Small Cap | 0.1% | 2.3% | 16.8% |
| UTI Nifty Next 50 Index | -1.3% | 5.3% | 13.1% |
| Parag Parikh Flexi Cap | -0.4% | -0.3% | 15.5% |
| Bandhan Small Cap | -0.1% | 5.2% | 29.6% |
Stocks Watchlist | 1W | 1Y | 5Y |
|---|---|---|---|
| Motilal Oswal NASDAQ 100 ETF | 1.9% | 88.9% | NA |
| Mirae Asset NYSE FANG+ETF | 2.7% | 51.1% | NA |
| Nippon India ETF Gold BeES | -0.8% | 57.2% | NA |
| HDFC Bank | -0.1% | -23.0% | 1.2% |
| Tata Gold | 0.1% | 57.2% | NA |
US Stocks Watchlist | 1W | 1Y | 5Y |
|---|---|---|---|
| Direxion Daily Semiconductor Bull 3X ETF | -23.2% | 870.4% | 35.6% |
| Micron Technology Inc. | -16.6% | 678.7% | 60.3% |
| PROSHARES ULTRA SEMICONDUCT | -16.2% | 199.0% | 61.8% |
| Taiwan Semiconductor Manufacturing Co. | -4.7% | 100.6% | 28.3% |
| NVIDIA | -8.6% | 43.8% | 63.5% |
Data Source: NSE, BSE & Kuvera.in
Strategies for navigating Market Cycles.
Watch/hear on YouTube:
Start investing through a platform that brings goal planning and investing to your fingertips. Visit kuvera.in to discover Direct Plans and Fixed Deposits and start investing today.
Disclaimer: Mutual Fund investments are subject to market risks. Read all scheme related documents carefully.
Registration granted by SEBI, membership of IAASB (in case of IAs) and certification from NISM in no way guarantee performance of the intermediary or provide any assurance of returns to investors.
Investment in the securities is subject to market risks. Read all the related documents carefully before investing.
The securities quoted are for illustration only and are not recommendatory.
This market update was initially published by Livemint.
#MutualFundSahiHai, #KuveraSabseSahiHai!